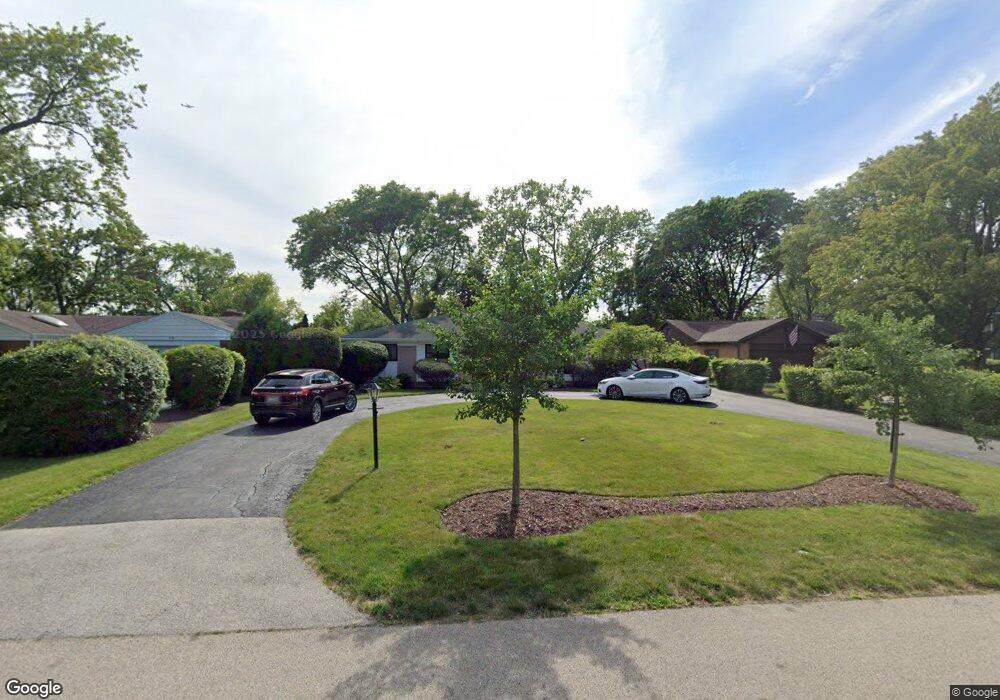
320 N Branch Rd Glenview, IL 60025
Estimated Value: $996,000 - $1,191,000
4
Beds
4
Baths
2,790
Sq Ft
$398/Sq Ft
Est. Value
About This Home
This home is located at 320 N Branch Rd, Glenview, IL 60025 and is currently estimated at $1,109,829, approximately $397 per square foot. 320 N Branch Rd is a home located in Cook County with nearby schools including Lyon Elementary School, Pleasant Ridge Elementary School, and Springman Middle School.
Ownership History
Date
Name
Owned For
Owner Type
Purchase Details
Closed on
Aug 15, 2007
Sold by
Harrington Gail Regina and Barberio Allan J
Bought by
Grayson Beth H and Gaines Janet H
Current Estimated Value
Home Financials for this Owner
Home Financials are based on the most recent Mortgage that was taken out on this home.
Original Mortgage
$512,500
Outstanding Balance
$317,624
Interest Rate
6.25%
Mortgage Type
Unknown
Estimated Equity
$792,205
Purchase Details
Closed on
Aug 13, 2007
Sold by
Grayson Beth H and Gaines Janet H
Bought by
Jordan James Daniel and Rendon Wilma M
Home Financials for this Owner
Home Financials are based on the most recent Mortgage that was taken out on this home.
Original Mortgage
$512,500
Outstanding Balance
$317,624
Interest Rate
6.25%
Mortgage Type
Unknown
Estimated Equity
$792,205
Purchase Details
Closed on
Jun 9, 1995
Sold by
Harrington Nancy R
Bought by
Harrington Nancy R
Create a Home Valuation Report for This Property
The Home Valuation Report is an in-depth analysis detailing your home's value as well as a comparison with similar homes in the area
Home Values in the Area
Average Home Value in this Area
Purchase History
| Date | Buyer | Sale Price | Title Company |
|---|---|---|---|
| Grayson Beth H | -- | Lawyers | |
| Jordan James Daniel | $722,500 | Lawyers | |
| Harrington Nancy R | -- | -- |
Source: Public Records
Mortgage History
| Date | Status | Borrower | Loan Amount |
|---|---|---|---|
| Open | Jordan James Daniel | $512,500 |
Source: Public Records
Tax History Compared to Growth
Tax History
| Year | Tax Paid | Tax Assessment Tax Assessment Total Assessment is a certain percentage of the fair market value that is determined by local assessors to be the total taxable value of land and additions on the property. | Land | Improvement |
|---|---|---|---|---|
| 2024 | $16,303 | $77,255 | $26,840 | $50,415 |
| 2023 | $15,823 | $77,255 | $26,840 | $50,415 |
| 2022 | $15,823 | $77,255 | $26,840 | $50,415 |
| 2021 | $15,553 | $66,038 | $14,640 | $51,398 |
| 2020 | $15,428 | $66,038 | $14,640 | $51,398 |
| 2019 | $15,756 | $79,213 | $14,640 | $64,573 |
| 2018 | $13,636 | $62,922 | $12,200 | $50,722 |
| 2017 | $13,288 | $62,922 | $12,200 | $50,722 |
| 2016 | $14,585 | $71,685 | $12,200 | $59,485 |
| 2015 | $14,600 | $64,152 | $9,760 | $54,392 |
| 2014 | $14,336 | $64,152 | $9,760 | $54,392 |
| 2013 | $13,885 | $64,152 | $9,760 | $54,392 |
Source: Public Records
Map
Nearby Homes
- 1123 Longvalley Rd
- 1121 Longvalley Rd
- 601 Carriage Hill Dr
- 245 Nora Ave
- 609 Carriage Hill Dr
- 1821 George Ct
- 711 Carriage Hill Dr
- 713 Carriage Hill Dr
- 1125 Longvalley Rd
- 315 Lincoln St
- 7030 Foster St
- 6619 Palma Ln
- 9523 Oconto Ave
- 1119 Longvalley Rd
- 7324 Palma Ln
- 1800 Dewes St Unit 305
- 1800 Dewes St Unit 201
- 6909 Beckwith Rd
- 9244 Newcastle Ave
- 9400 Octavia Ave
- 330 N Branch Rd
- 318 N Branch Rd Unit 603
- 336 N Branch Rd
- 310 N Branch Rd
- 342 N Branch Rd
- 304 N Branch Rd
- 323 N Branch Rd
- 315 N Branch Rd
- 333 N Branch Rd
- 348 N Branch Rd
- 300 N Branch Rd
- 305 N Branch Rd
- 339 N Branch Rd
- 400 N Branch Rd
- 260 N Branch Rd
- 333 Waukegan Rd
- 333 Waukegan Rd Unit F
- 333 Waukegan Rd Unit D
- 333 Waukegan Rd Unit C
- 333 Waukegan Rd Unit E