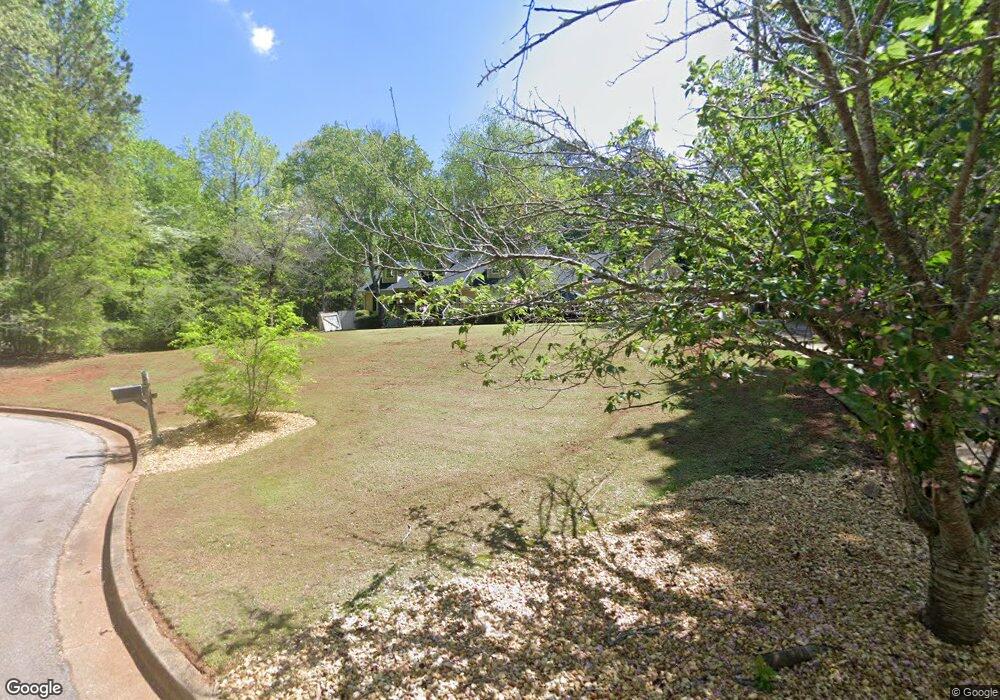
320 N Grove Ct McDonough, GA 30252
Estimated Value: $365,000 - $495,000
6
Beds
4
Baths
3,932
Sq Ft
$107/Sq Ft
Est. Value
About This Home
This home is located at 320 N Grove Ct, McDonough, GA 30252 and is currently estimated at $420,065, approximately $106 per square foot. 320 N Grove Ct is a home located in Henry County with nearby schools including Pleasant Grove Elementary School, Woodland Middle School, and Woodland High School.
Ownership History
Date
Name
Owned For
Owner Type
Purchase Details
Closed on
Jun 28, 2004
Sold by
Hojeij Carol K
Bought by
Freshwater Brian S and Freshwater Julie
Current Estimated Value
Home Financials for this Owner
Home Financials are based on the most recent Mortgage that was taken out on this home.
Original Mortgage
$21,000
Interest Rate
6.22%
Mortgage Type
Unknown
Purchase Details
Closed on
Oct 8, 1993
Sold by
Collins Construction
Bought by
Hojeij Carol K
Home Financials for this Owner
Home Financials are based on the most recent Mortgage that was taken out on this home.
Original Mortgage
$93,800
Interest Rate
3.87%
Create a Home Valuation Report for This Property
The Home Valuation Report is an in-depth analysis detailing your home's value as well as a comparison with similar homes in the area
Home Values in the Area
Average Home Value in this Area
Purchase History
| Date | Buyer | Sale Price | Title Company |
|---|---|---|---|
| Freshwater Brian S | $210,000 | -- | |
| Hojeij Carol K | $117,300 | -- |
Source: Public Records
Mortgage History
| Date | Status | Borrower | Loan Amount |
|---|---|---|---|
| Closed | Freshwater Brian S | $21,000 | |
| Open | Freshwater Brian S | $168,000 | |
| Previous Owner | Hojeij Carol K | $93,800 |
Source: Public Records
Tax History Compared to Growth
Tax History
| Year | Tax Paid | Tax Assessment Tax Assessment Total Assessment is a certain percentage of the fair market value that is determined by local assessors to be the total taxable value of land and additions on the property. | Land | Improvement |
|---|---|---|---|---|
| 2025 | $4,037 | $151,280 | $16,000 | $135,280 |
| 2024 | $4,037 | $147,720 | $16,000 | $131,720 |
| 2023 | $4,209 | $140,480 | $12,000 | $128,480 |
| 2022 | $4,339 | $127,320 | $12,000 | $115,320 |
| 2021 | $3,920 | $113,240 | $12,000 | $101,240 |
| 2020 | $3,857 | $110,760 | $10,800 | $99,960 |
| 2019 | $3,452 | $97,280 | $10,800 | $86,480 |
| 2018 | $3,319 | $92,640 | $10,000 | $82,640 |
| 2016 | $2,868 | $80,800 | $8,800 | $72,000 |
| 2015 | $2,175 | $61,280 | $7,200 | $54,080 |
| 2014 | $2,047 | $57,520 | $7,200 | $50,320 |
Source: Public Records
Map
Nearby Homes
- 1404 Lancaster Ct
- 310 Pleasant Grove Rd
- 450 Kelleytown Rd
- 96 Ashtonbrook Dr
- 108 Ashtonbrook Dr
- 312 Dovehouse St
- 136 Asa Moseley Rd
- 142 Asa Moseley Rd
- 1307 Regatta Way
- 148 Asa Moseley Rd
- 150 Asa Moseley Rd
- 3669 E Fairview Rd
- 0 Asa Moseley Rd
- 145 Asa Mosley Rd
- 501 Wedgepark Dr Unit 4
- 2983 E Fairview Rd
- 110 Eastfield Ct
- 349 Asa Moseley Rd
- 3003 E Fairview Rd
- 711 Forestglen Dr
- 330 N Grove Ct
- 310 N Grove Ct
- 146 Pleasant Grove Rd
- 142 Pleasant Grove Rd
- 340 N Grove Ct
- 335 N Grove Ct
- N N Grove Ct
- 150 Pleasant Grove Rd
- 140 Pleasant Grove Rd
- 300 N Grove Ct
- 315 N Grove Ct
- 205 Pleasant Grove Rd Unit 1
- 350 N Grove Ct
- 1001 Landmark Dr
- 160 Pleasant Grove Rd
- 345 N Grove Ct
- 191 Pleasant Grove Rd Unit 1
- 130 Pleasant Grove Rd
- 220 Pleasant Grove Cir
- 250 Pleasant Grove Cir