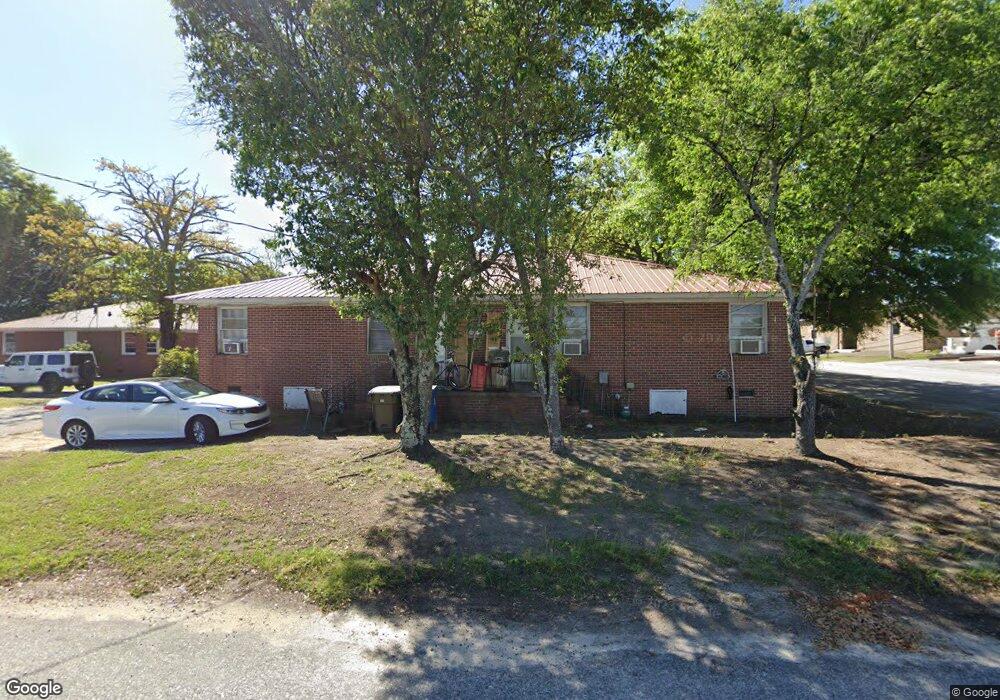
320 N Parson St West Columbia, SC 29169
Estimated Value: $155,000 - $258,000
4
Beds
2
Baths
1,892
Sq Ft
$106/Sq Ft
Est. Value
About This Home
This home is located at 320 N Parson St, West Columbia, SC 29169 and is currently estimated at $200,210, approximately $105 per square foot. 320 N Parson St is a home located in Lexington County with nearby schools including Riverbank Elementary, Cyril B. Busbee Creative Arts Academy, and Brookland-Cayce High School.
Ownership History
Date
Name
Owned For
Owner Type
Purchase Details
Closed on
Aug 20, 2025
Sold by
Hendrix Dorothy S
Bought by
Avs Home Buyers Llc
Current Estimated Value
Home Financials for this Owner
Home Financials are based on the most recent Mortgage that was taken out on this home.
Original Mortgage
$350,000
Outstanding Balance
$321,721
Interest Rate
6.72%
Mortgage Type
Construction
Estimated Equity
-$121,511
Purchase Details
Closed on
Apr 4, 2024
Sold by
Hendrix Elmer Ray Jack
Bought by
Hendrix Dorothy S
Create a Home Valuation Report for This Property
The Home Valuation Report is an in-depth analysis detailing your home's value as well as a comparison with similar homes in the area
Home Values in the Area
Average Home Value in this Area
Purchase History
| Date | Buyer | Sale Price | Title Company |
|---|---|---|---|
| Avs Home Buyers Llc | $350,000 | None Listed On Document | |
| Hendrix Dorothy S | -- | None Listed On Document | |
| Hendrix Dorothy S | -- | None Listed On Document |
Source: Public Records
Mortgage History
| Date | Status | Borrower | Loan Amount |
|---|---|---|---|
| Open | Avs Home Buyers Llc | $350,000 |
Source: Public Records
Tax History Compared to Growth
Tax History
| Year | Tax Paid | Tax Assessment Tax Assessment Total Assessment is a certain percentage of the fair market value that is determined by local assessors to be the total taxable value of land and additions on the property. | Land | Improvement |
|---|---|---|---|---|
| 2024 | $2,644 | $6,139 | $509 | $5,630 |
| 2023 | $2,424 | $6,139 | $509 | $5,630 |
| 2022 | $2,296 | $6,139 | $509 | $5,630 |
| 2020 | $2,177 | $6,139 | $509 | $5,630 |
| 2019 | $1,912 | $5,338 | $550 | $4,788 |
| 2018 | $1,897 | $5,338 | $550 | $4,788 |
| 2017 | $1,861 | $5,338 | $550 | $4,788 |
| 2016 | $1,883 | $5,337 | $549 | $4,788 |
| 2014 | $1,421 | $4,642 | $900 | $3,742 |
| 2013 | -- | $4,640 | $900 | $3,740 |
Source: Public Records
Map
Nearby Homes