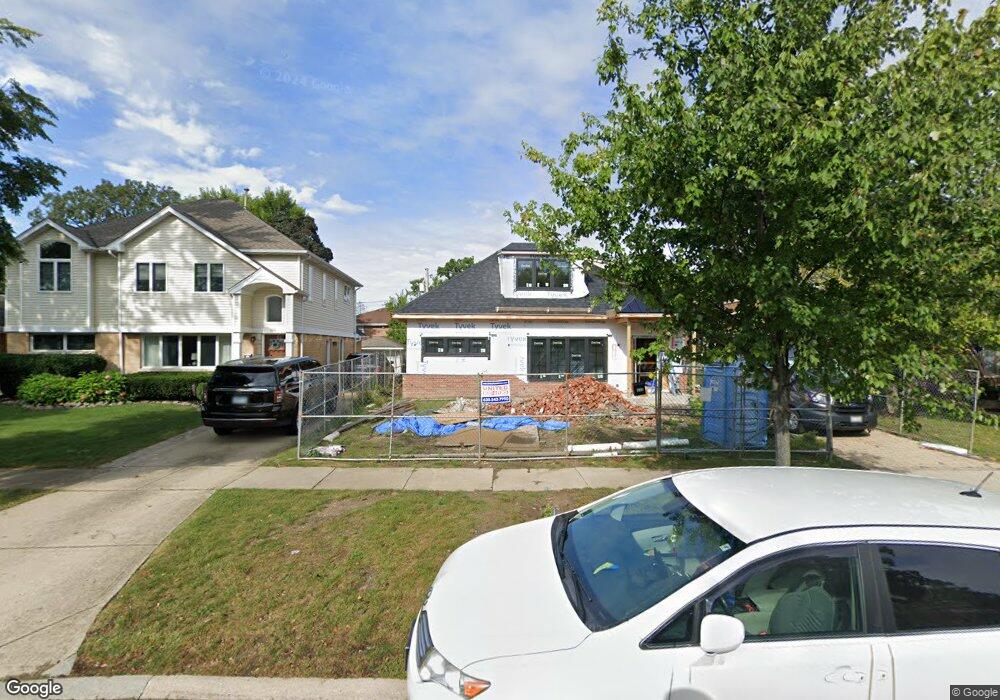
320 N Redfield Ct Park Ridge, IL 60068
Estimated Value: $462,041 - $601,000
4
Beds
3
Baths
2,164
Sq Ft
$241/Sq Ft
Est. Value
About This Home
This home is located at 320 N Redfield Ct, Park Ridge, IL 60068 and is currently estimated at $521,010, approximately $240 per square foot. 320 N Redfield Ct is a home located in Cook County with nearby schools including George B Carpenter Elementary School, Lincoln Middle School, and Maine South High School.
Ownership History
Date
Name
Owned For
Owner Type
Purchase Details
Closed on
Jun 14, 2019
Sold by
320 Redfield Llc
Bought by
Zdrzalka Piotr and Zdrzalka Violetta
Current Estimated Value
Purchase Details
Closed on
Oct 30, 2018
Sold by
Zdrzalka Piotr and Zdrzalka Violetta
Bought by
320 Redfield Llc
Purchase Details
Closed on
Oct 28, 2004
Sold by
A & D Development Llc
Bought by
Zdrzalka Piotr
Home Financials for this Owner
Home Financials are based on the most recent Mortgage that was taken out on this home.
Original Mortgage
$391,875
Interest Rate
5.5%
Mortgage Type
Adjustable Rate Mortgage/ARM
Purchase Details
Closed on
Jun 30, 2004
Sold by
Crowley Grace M
Bought by
A & D Development Llc
Home Financials for this Owner
Home Financials are based on the most recent Mortgage that was taken out on this home.
Original Mortgage
$236,250
Interest Rate
4%
Mortgage Type
Unknown
Create a Home Valuation Report for This Property
The Home Valuation Report is an in-depth analysis detailing your home's value as well as a comparison with similar homes in the area
Home Values in the Area
Average Home Value in this Area
Purchase History
| Date | Buyer | Sale Price | Title Company |
|---|---|---|---|
| Zdrzalka Piotr | -- | None Available | |
| 320 Redfield Llc | -- | Attorney | |
| Zdrzalka Piotr | $412,500 | Cti | |
| A & D Development Llc | $315,000 | Cti |
Source: Public Records
Mortgage History
| Date | Status | Borrower | Loan Amount |
|---|---|---|---|
| Previous Owner | Zdrzalka Piotr | $391,875 | |
| Previous Owner | A & D Development Llc | $236,250 |
Source: Public Records
Tax History Compared to Growth
Tax History
| Year | Tax Paid | Tax Assessment Tax Assessment Total Assessment is a certain percentage of the fair market value that is determined by local assessors to be the total taxable value of land and additions on the property. | Land | Improvement |
|---|---|---|---|---|
| 2024 | $5,475 | $33,658 | $8,580 | $25,078 |
| 2023 | $8,247 | $21,830 | $8,580 | $13,250 |
| 2022 | $8,247 | $35,130 | $8,580 | $26,550 |
| 2021 | $6,693 | $25,338 | $5,610 | $19,728 |
| 2020 | $6,494 | $25,338 | $5,610 | $19,728 |
| 2019 | $6,444 | $28,154 | $5,610 | $22,544 |
| 2018 | $6,331 | $25,557 | $4,950 | $20,607 |
| 2017 | $6,321 | $25,557 | $4,950 | $20,607 |
| 2016 | $6,327 | $25,557 | $4,950 | $20,607 |
| 2015 | $5,301 | $19,809 | $4,290 | $15,519 |
| 2014 | $5,213 | $19,809 | $4,290 | $15,519 |
| 2013 | $4,920 | $19,809 | $4,290 | $15,519 |
Source: Public Records
Map
Nearby Homes
- 2121 W Sibley St
- 601 N Broadway Ave
- 300 Boardwalk Place Unit T300
- 408 N Seminary Ave
- 44 Park Ln Unit 223
- 44 Park Ln Unit 435
- 22 Park Ln Unit 203
- 20 S Dee Rd
- 60 S Dee Rd Unit G
- 819 Busse Hwy
- 716 N Western Ave
- 911 Busse Hwy Unit 302
- 776 N Northwest Hwy
- 832 Sylviawood Ave
- 722 N Northwest Hwy Unit A
- 200 Thames Pkwy Unit 1
- 2200 Bouterse St Unit 409B
- 2200 Bouterse St Unit 407
- 751 N Northwest Hwy
- 747 N Northwest Hwy
- 400 N Redfield Ct
- 316 N Redfield Ct
- 404 N Redfield Ct
- 312 N Redfield Ct
- 321 N Dee Rd
- 403 N Dee Rd
- 408 N Redfield Ct
- 308 N Redfield Ct
- 409 N Dee Rd
- 311 N Dee Rd
- 321 N Redfield Ct
- 412 N Redfield Ct
- 411 N Dee Rd
- 411 N Dee Rd
- 304 N Redfield Ct
- 317 N Redfield Ct
- 309 N Dee Rd
- 401 N Redfield Ct
- 405 N Redfield Ct
- 309 N Redfield Ct