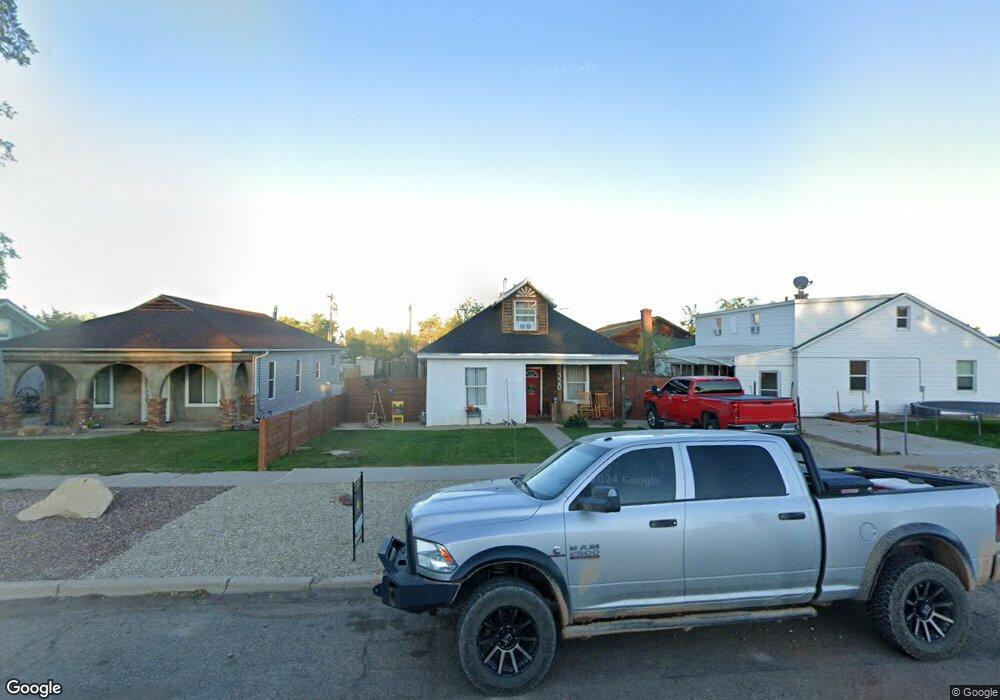
320 N State St Roosevelt, UT 84066
Estimated Value: $223,000 - $258,000
2
Beds
1
Bath
1,084
Sq Ft
$225/Sq Ft
Est. Value
About This Home
This home is located at 320 N State St, Roosevelt, UT 84066 and is currently estimated at $243,584, approximately $224 per square foot. 320 N State St is a home located in Duchesne County with nearby schools including East School, Roosevelt Junior High School, and Union High School.
Ownership History
Date
Name
Owned For
Owner Type
Purchase Details
Closed on
Nov 18, 2024
Sold by
Odriscoll Jared and Odriscoll Bradi
Bought by
Johns Matthew J
Current Estimated Value
Home Financials for this Owner
Home Financials are based on the most recent Mortgage that was taken out on this home.
Original Mortgage
$242,424
Outstanding Balance
$240,100
Interest Rate
6.32%
Mortgage Type
Construction
Estimated Equity
$3,484
Purchase Details
Closed on
Dec 28, 2021
Sold by
Emf Rentals Llc
Bought by
Odriscoll Jared
Home Financials for this Owner
Home Financials are based on the most recent Mortgage that was taken out on this home.
Original Mortgage
$80,750
Interest Rate
3.1%
Mortgage Type
Construction
Create a Home Valuation Report for This Property
The Home Valuation Report is an in-depth analysis detailing your home's value as well as a comparison with similar homes in the area
Home Values in the Area
Average Home Value in this Area
Purchase History
| Date | Buyer | Sale Price | Title Company |
|---|---|---|---|
| Johns Matthew J | $303,030 | Basin Land Title - Roosevelt | |
| Odriscoll Jared | $100,938 | Farm & Home Title Ins Agency |
Source: Public Records
Mortgage History
| Date | Status | Borrower | Loan Amount |
|---|---|---|---|
| Open | Johns Matthew J | $242,424 | |
| Previous Owner | Odriscoll Jared | $80,750 |
Source: Public Records
Tax History
| Year | Tax Paid | Tax Assessment Tax Assessment Total Assessment is a certain percentage of the fair market value that is determined by local assessors to be the total taxable value of land and additions on the property. | Land | Improvement |
|---|---|---|---|---|
| 2025 | $1,448 | $214,802 | $41,000 | $173,802 |
| 2024 | $827 | $123,263 | $35,387 | $87,876 |
| 2023 | $827 | $99,747 | $32,150 | $67,597 |
| 2022 | $596 | $42,597 | $15,620 | $26,977 |
| 2021 | $552 | $63,107 | $24,900 | $38,207 |
| 2020 | $479 | $55,604 | $24,900 | $30,704 |
| 2019 | $479 | $55,604 | $24,900 | $30,704 |
| 2018 | $492 | $55,604 | $24,900 | $30,704 |
| 2017 | $467 | $0 | $0 | $0 |
| 2016 | $646 | $0 | $0 | $0 |
| 2015 | $614 | $0 | $0 | $0 |
| 2014 | $598 | $78,514 | $24,480 | $54,034 |
| 2013 | $571 | $71,263 | $24,480 | $46,783 |
Source: Public Records
Map
Nearby Homes
Your Personal Tour Guide
Ask me questions while you tour the home.