320 Old Sutton Rd Barrington, IL 60010
Estimated Value: $854,000 - $951,000
3
Beds
4
Baths
3,200
Sq Ft
$279/Sq Ft
Est. Value
About This Home
This home is located at 320 Old Sutton Rd, Barrington, IL 60010 and is currently estimated at $892,298, approximately $278 per square foot. 320 Old Sutton Rd is a home located in Cook County with nearby schools including Countryside Elementary School, Barrington Mdle School- Prairie Cmps, and Barrington High School.
Ownership History
Date
Name
Owned For
Owner Type
Purchase Details
Closed on
Feb 28, 2025
Sold by
Kavanagh Thomas and Kavanagh Lisa
Bought by
Lisa A Kavanagh Trust and Kavanagh
Current Estimated Value
Purchase Details
Closed on
Sep 3, 2010
Sold by
Brix J Christian
Bought by
Kavanagh Thomas and Kavanagh Lisa
Home Financials for this Owner
Home Financials are based on the most recent Mortgage that was taken out on this home.
Original Mortgage
$510,000
Interest Rate
4.35%
Mortgage Type
New Conventional
Purchase Details
Closed on
Dec 16, 2002
Sold by
Brix J Christian
Bought by
Brix J Christian and The J Christian Brix Revocable Trust
Purchase Details
Closed on
Jun 24, 1997
Sold by
Guerri Ernest C
Bought by
Brix J Christian
Home Financials for this Owner
Home Financials are based on the most recent Mortgage that was taken out on this home.
Original Mortgage
$248,000
Interest Rate
7.5%
Create a Home Valuation Report for This Property
The Home Valuation Report is an in-depth analysis detailing your home's value as well as a comparison with similar homes in the area
Home Values in the Area
Average Home Value in this Area
Purchase History
| Date | Buyer | Sale Price | Title Company |
|---|---|---|---|
| Lisa A Kavanagh Trust | -- | None Listed On Document | |
| Kavanagh Thomas | $600,000 | Attorneys Title Guaranty Fun | |
| Brix J Christian | -- | -- | |
| Brix J Christian | $310,000 | -- |
Source: Public Records
Mortgage History
| Date | Status | Borrower | Loan Amount |
|---|---|---|---|
| Previous Owner | Kavanagh Thomas | $510,000 | |
| Previous Owner | Brix J Christian | $248,000 |
Source: Public Records
Tax History
| Year | Tax Paid | Tax Assessment Tax Assessment Total Assessment is a certain percentage of the fair market value that is determined by local assessors to be the total taxable value of land and additions on the property. | Land | Improvement |
|---|---|---|---|---|
| 2025 | $12,948 | $81,001 | $24,260 | $56,741 |
| 2024 | $12,948 | $57,380 | $24,260 | $33,120 |
| 2023 | $12,616 | $57,380 | $24,260 | $33,120 |
| 2022 | $12,616 | $57,380 | $24,260 | $33,120 |
| 2021 | $15,892 | $62,690 | $24,259 | $38,431 |
| 2020 | $15,483 | $62,690 | $24,259 | $38,431 |
| 2019 | $15,061 | $69,656 | $24,259 | $45,397 |
| 2018 | $14,765 | $66,992 | $18,194 | $48,798 |
| 2017 | $14,454 | $66,992 | $18,194 | $48,798 |
| 2016 | $14,397 | $69,448 | $18,194 | $51,254 |
| 2015 | $13,828 | $60,021 | $12,129 | $47,892 |
| 2014 | $13,815 | $60,021 | $12,129 | $47,892 |
| 2013 | $13,255 | $60,021 | $12,129 | $47,892 |
Source: Public Records
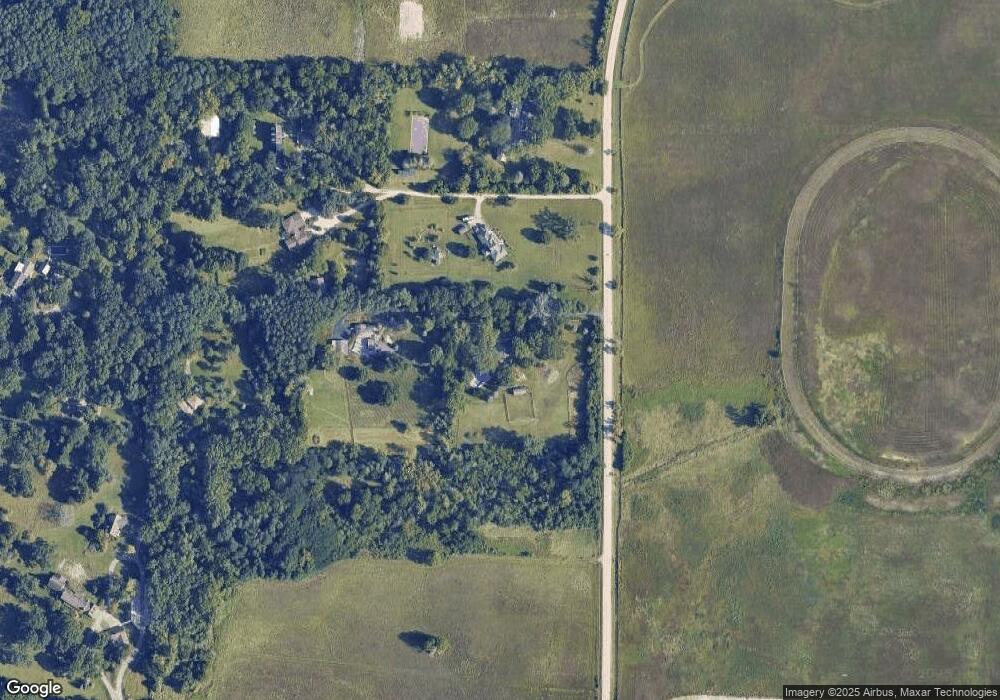
Map
Nearby Homes
- 325 Old Sutton Rd
- 321 Old Sutton Rd
- 326 Old Sutton Rd
- 324 Old Sutton Rd
- 324 Old Sutton Rd
- 322 Old Sutton Rd
- 165 Algonquin Rd
- 162 Springwood Ln
- 164 Springwood Ln
- 163 Springwood Ln
- 331 Old Sutton Rd
- 311 Algonquin Rd
- 332 Old Sutton Rd
- 332 Old Sutton Rd
- 15N272 Old Sutton Rd
- 15N365 Old Sutton Rd
- 15N396 Old Sutton Rd
- 128 Brinker Rd
- 170 Old Sutton Rd
- 312 Algonquin Rd
Your Personal Tour Guide
Ask me questions while you tour the home.