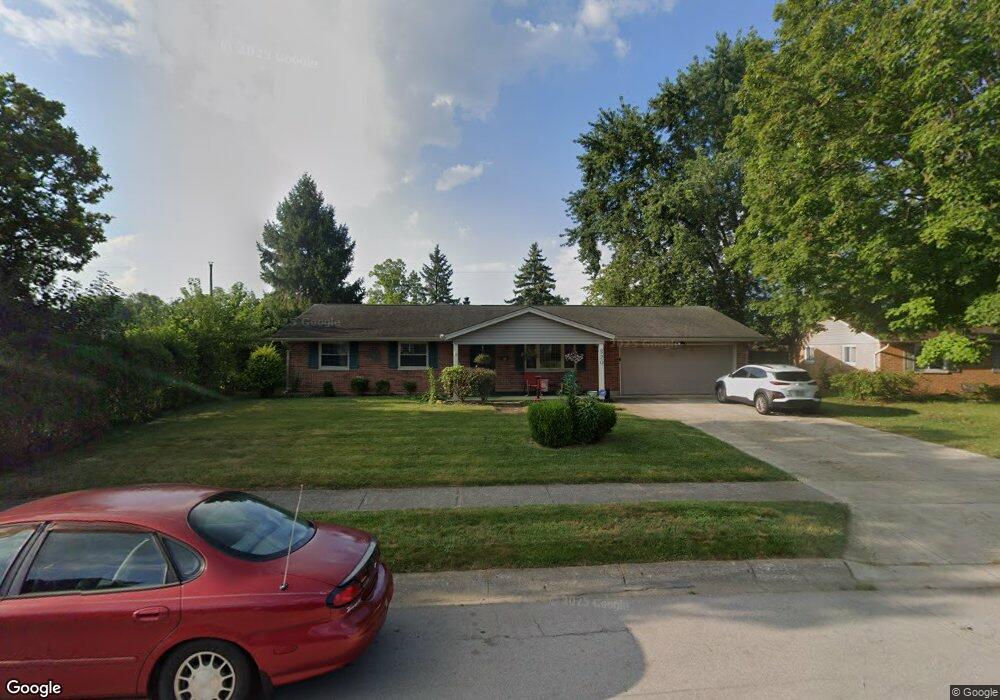
320 Oldham Way Englewood, OH 45322
Estimated Value: $221,000 - $248,000
4
Beds
2
Baths
2,046
Sq Ft
$114/Sq Ft
Est. Value
About This Home
This home is located at 320 Oldham Way, Englewood, OH 45322 and is currently estimated at $232,623, approximately $113 per square foot. 320 Oldham Way is a home located in Montgomery County with nearby schools including Northmont High School, Trotwood Preparatory & Fitness Academy, and Imagine Schools - Woodbury Academy.
Ownership History
Date
Name
Owned For
Owner Type
Purchase Details
Closed on
Oct 27, 2017
Sold by
Barrett Mary Ann and Barrett Mary Ann
Bought by
Craig John
Current Estimated Value
Home Financials for this Owner
Home Financials are based on the most recent Mortgage that was taken out on this home.
Original Mortgage
$122,735
Outstanding Balance
$104,561
Interest Rate
4.5%
Mortgage Type
FHA
Estimated Equity
$128,062
Purchase Details
Closed on
Nov 4, 1998
Sold by
Gibson Don J and Gibson Jennifer K
Bought by
Barrett Charles D and Barrett Mary Ann
Home Financials for this Owner
Home Financials are based on the most recent Mortgage that was taken out on this home.
Original Mortgage
$60,000
Interest Rate
6.72%
Purchase Details
Closed on
Feb 12, 1997
Sold by
Hartman Clyde E and Hartman Ruth Ann
Bought by
Gibson Don J and Gibson Jennifer K
Create a Home Valuation Report for This Property
The Home Valuation Report is an in-depth analysis detailing your home's value as well as a comparison with similar homes in the area
Home Values in the Area
Average Home Value in this Area
Purchase History
| Date | Buyer | Sale Price | Title Company |
|---|---|---|---|
| Craig John | $125,000 | None Available | |
| Barrett Charles D | $108,500 | -- | |
| Barrett Charles D | $108,500 | -- | |
| Gibson Don J | $99,000 | -- |
Source: Public Records
Mortgage History
| Date | Status | Borrower | Loan Amount |
|---|---|---|---|
| Open | Craig John | $122,735 | |
| Previous Owner | Barrett Charles D | $60,000 |
Source: Public Records
Tax History Compared to Growth
Tax History
| Year | Tax Paid | Tax Assessment Tax Assessment Total Assessment is a certain percentage of the fair market value that is determined by local assessors to be the total taxable value of land and additions on the property. | Land | Improvement |
|---|---|---|---|---|
| 2024 | $3,654 | $64,100 | $9,800 | $54,300 |
| 2023 | $3,654 | $64,100 | $9,800 | $54,300 |
| 2022 | $3,338 | $45,060 | $6,900 | $38,160 |
| 2021 | $3,348 | $45,060 | $6,900 | $38,160 |
| 2020 | $3,286 | $45,060 | $6,900 | $38,160 |
| 2019 | $2,942 | $36,150 | $7,940 | $28,210 |
| 2018 | $2,889 | $36,150 | $7,940 | $28,210 |
| 2017 | $2,180 | $36,150 | $7,940 | $28,210 |
| 2016 | $2,087 | $34,510 | $6,900 | $27,610 |
| 2015 | $1,908 | $34,510 | $6,900 | $27,610 |
| 2014 | $1,908 | $34,510 | $6,900 | $27,610 |
| 2012 | -- | $36,240 | $7,640 | $28,600 |
Source: Public Records
Map
Nearby Homes
- 717 Woodlawn Ave
- 510 Lambert Ln
- 718 Bonnycastle Ave
- 803 Albert St
- 510 Rohr Ln
- 1010 Heathwood Dr
- 206 Lodestone Dr
- 505 Durst Dr
- 534 Unger Ave
- 104 Silverstone Dr
- 1017 Terracewood Dr
- 1008 Merrywood Dr
- 109 Silverstone Dr
- 520 S Main St
- 607 Albert St
- 206 Gardengrove Way
- 108 Tate Ave
- 229 Brookwood Dr
- 208 S Walnut St
- 108 Denwood Trail