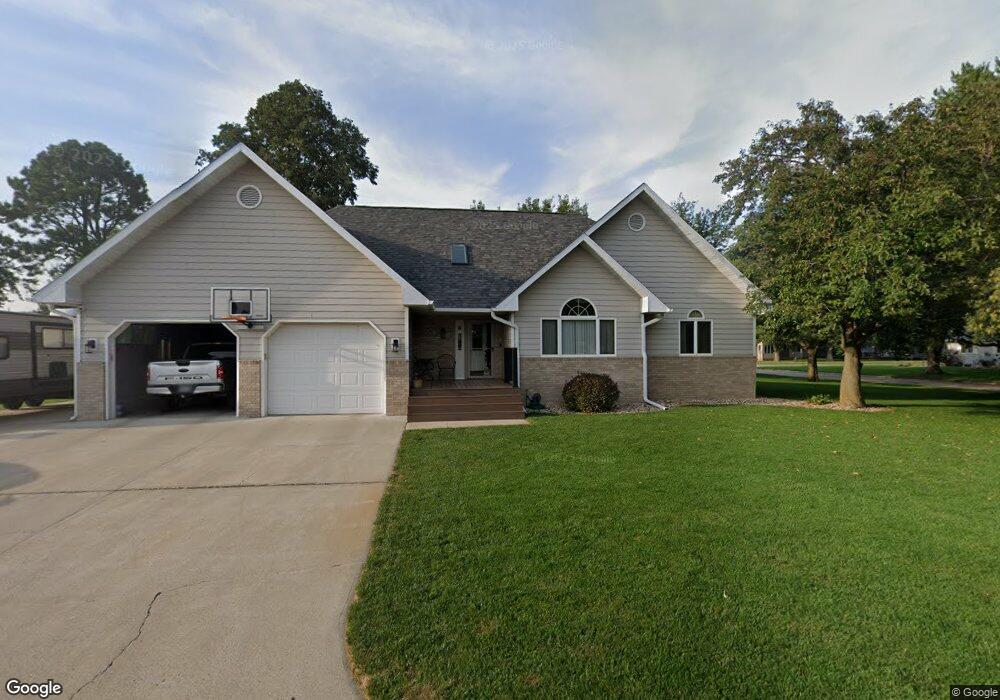
320 Pike Ct Whiting, IA 51063
Estimated Value: $205,000 - $401,000
4
Beds
3
Baths
1,788
Sq Ft
$175/Sq Ft
Est. Value
About This Home
This home is located at 320 Pike Ct, Whiting, IA 51063 and is currently estimated at $313,038, approximately $175 per square foot. 320 Pike Ct is a home located in Monona County with nearby schools including Whiting Elementary School and Whiting Senior High School.
Ownership History
Date
Name
Owned For
Owner Type
Purchase Details
Closed on
Sep 11, 2015
Sold by
Neldeberg Ryan N and Neldeberg Erin R
Bought by
Mcfarland Hiram B and Mcfarland Brenda J
Current Estimated Value
Home Financials for this Owner
Home Financials are based on the most recent Mortgage that was taken out on this home.
Original Mortgage
$209,407
Outstanding Balance
$164,419
Interest Rate
3.9%
Mortgage Type
VA
Estimated Equity
$148,619
Purchase Details
Closed on
Feb 18, 2008
Sold by
Larson Carolyn A
Bought by
Neldeberg Ryan A and Mohler Erin R
Home Financials for this Owner
Home Financials are based on the most recent Mortgage that was taken out on this home.
Original Mortgage
$180,000
Interest Rate
5.75%
Mortgage Type
New Conventional
Create a Home Valuation Report for This Property
The Home Valuation Report is an in-depth analysis detailing your home's value as well as a comparison with similar homes in the area
Purchase History
| Date | Buyer | Sale Price | Title Company |
|---|---|---|---|
| Mcfarland Hiram B | $205,000 | None Available | |
| Neldeberg Ryan A | $190,000 | None Available |
Source: Public Records
Mortgage History
| Date | Status | Borrower | Loan Amount |
|---|---|---|---|
| Open | Mcfarland Hiram B | $209,407 | |
| Previous Owner | Neldeberg Ryan A | $180,000 |
Source: Public Records
Tax History
| Year | Tax Paid | Tax Assessment Tax Assessment Total Assessment is a certain percentage of the fair market value that is determined by local assessors to be the total taxable value of land and additions on the property. | Land | Improvement |
|---|---|---|---|---|
| 2024 | $4,492 | $312,628 | $19,230 | $293,398 |
| 2023 | $4,190 | $312,628 | $19,230 | $293,398 |
| 2022 | $3,504 | $218,664 | $0 | $0 |
| 2021 | $3,574 | $214,037 | $19,623 | $194,414 |
| 2020 | $3,410 | $214,037 | $19,623 | $194,414 |
| 2019 | $3,410 | $202,299 | $0 | $0 |
| 2018 | $3,374 | $202,298 | $0 | $0 |
| 2017 | $3,248 | $189,535 | $0 | $0 |
| 2016 | $3,248 | $189,535 | $0 | $0 |
| 2015 | $2,970 | $167,730 | $0 | $0 |
| 2014 | $2,684 | $167,730 | $0 | $0 |
Source: Public Records
Map
Nearby Homes
Your Personal Tour Guide
Ask me questions while you tour the home.