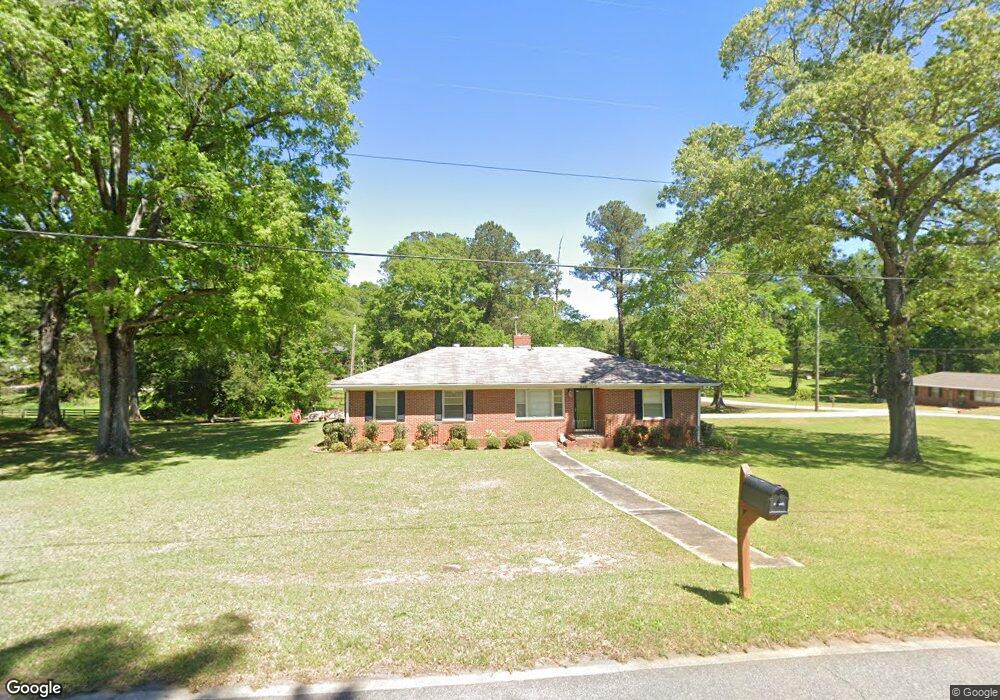
320 Poplar St Barnesville, GA 30204
Estimated Value: $224,691 - $268,000
3
Beds
2
Baths
1,672
Sq Ft
$150/Sq Ft
Est. Value
About This Home
This home is located at 320 Poplar St, Barnesville, GA 30204 and is currently estimated at $250,923, approximately $150 per square foot. 320 Poplar St is a home located in Lamar County with nearby schools including Lamar County Primary School, Lamar County Elementary School, and Lamar County Middle School.
Ownership History
Date
Name
Owned For
Owner Type
Purchase Details
Closed on
Dec 27, 2018
Sold by
Long Rachael A
Bought by
Smith Gary Thomas and Smith Ann Yvonne
Current Estimated Value
Purchase Details
Closed on
Jun 11, 2010
Sold by
White Carl A
Bought by
Long Rachael A
Home Financials for this Owner
Home Financials are based on the most recent Mortgage that was taken out on this home.
Original Mortgage
$98,671
Interest Rate
5.5%
Mortgage Type
FHA
Purchase Details
Closed on
Jul 17, 2008
Sold by
Kitchings Neal
Bought by
White Carl A and White Claudine P
Home Financials for this Owner
Home Financials are based on the most recent Mortgage that was taken out on this home.
Original Mortgage
$105,283
Interest Rate
6.03%
Mortgage Type
New Conventional
Purchase Details
Closed on
Jan 1, 1963
Bought by
Kitchings Neal
Create a Home Valuation Report for This Property
The Home Valuation Report is an in-depth analysis detailing your home's value as well as a comparison with similar homes in the area
Home Values in the Area
Average Home Value in this Area
Purchase History
| Date | Buyer | Sale Price | Title Company |
|---|---|---|---|
| Smith Gary Thomas | $119,000 | -- | |
| Long Rachael A | $100,000 | -- | |
| White Carl A | $105,000 | -- | |
| Kitchings Neal | -- | -- |
Source: Public Records
Mortgage History
| Date | Status | Borrower | Loan Amount |
|---|---|---|---|
| Previous Owner | Long Rachael A | $98,671 | |
| Previous Owner | White Carl A | $105,283 | |
| Closed | Smith Gary Thomas | $0 |
Source: Public Records
Tax History Compared to Growth
Tax History
| Year | Tax Paid | Tax Assessment Tax Assessment Total Assessment is a certain percentage of the fair market value that is determined by local assessors to be the total taxable value of land and additions on the property. | Land | Improvement |
|---|---|---|---|---|
| 2025 | $1,838 | $80,547 | $6,800 | $73,747 |
| 2024 | $1,838 | $65,827 | $6,800 | $59,027 |
| 2023 | $1,868 | $62,206 | $6,800 | $55,406 |
| 2022 | $1,702 | $63,530 | $6,800 | $56,730 |
| 2021 | $1,470 | $50,790 | $6,800 | $43,990 |
| 2020 | $1,361 | $44,882 | $6,800 | $38,082 |
| 2019 | $1,364 | $44,882 | $6,800 | $38,082 |
| 2018 | $1,092 | $35,830 | $6,800 | $29,030 |
| 2017 | $1,086 | $35,830 | $6,800 | $29,030 |
| 2016 | $1,086 | $35,830 | $6,800 | $29,030 |
| 2015 | $1,085 | $35,830 | $6,800 | $29,030 |
| 2014 | $1,052 | $35,830 | $6,800 | $29,030 |
| 2013 | -- | $35,830 | $6,800 | $29,030 |
Source: Public Records
Map
Nearby Homes
- 205 Pine St
- 0 College Dr Unit 10632977
- 306 Spencer St
- 00 Yatesville Rd Unit 1
- 0 Yatesville Rd Unit 24570293
- 0 Yatesville Rd Unit 10650403
- 110 Bradley Cir
- 108 Bradley Cir
- 0 Highway 341 S Unit 181569
- 0 Highway 341 S Unit 10610486
- 205 Georgia Ave
- 150 Georgia Ave
- 0 Us Highway 41
- 0 Veterns Pkwy Unit 10515268
- 308 Moye St
- 0 U S 341
- 531 Thomaston St
- 125 Byrd St
- 185 Coffey Rd Unit 11
- 187 Coffey Rd