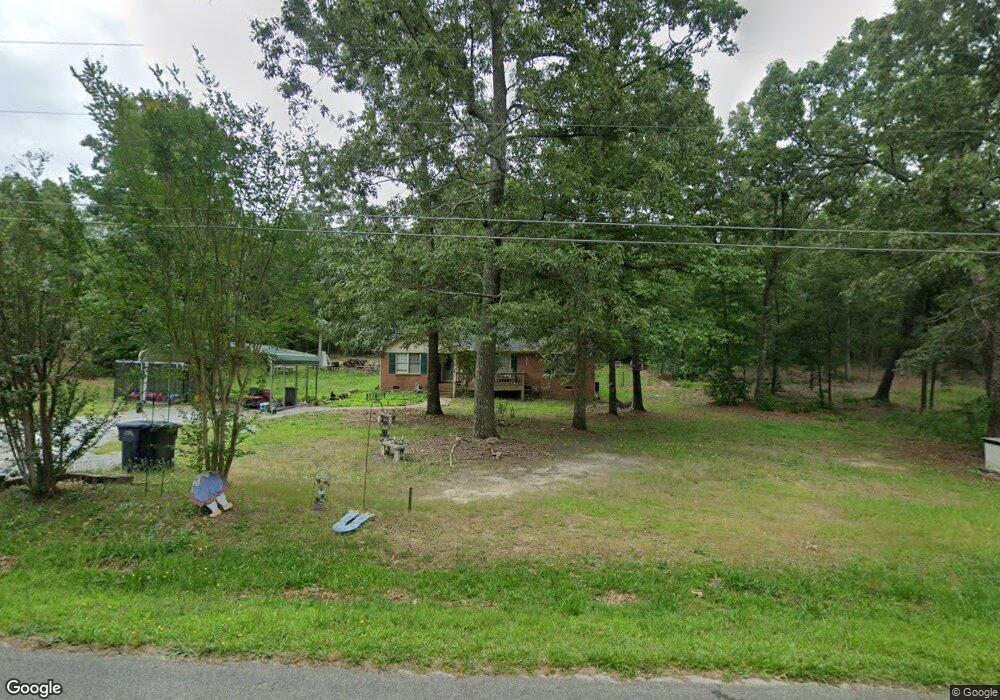
320 Red Leaf Rd Hartwell, GA 30643
Estimated Value: $206,000 - $305,000
3
Beds
2
Baths
1,329
Sq Ft
$198/Sq Ft
Est. Value
About This Home
This home is located at 320 Red Leaf Rd, Hartwell, GA 30643 and is currently estimated at $262,585, approximately $197 per square foot. 320 Red Leaf Rd is a home located in Hart County with nearby schools including Hart County High School.
Ownership History
Date
Name
Owned For
Owner Type
Purchase Details
Closed on
Sep 29, 2014
Sold by
Byrum Kristina M
Bought by
Byrum Ricky Dale
Current Estimated Value
Purchase Details
Closed on
Mar 25, 2008
Sold by
Byrum Ricky Dale
Bought by
Byrum Ricky Dale and Byrum Kristina M
Home Financials for this Owner
Home Financials are based on the most recent Mortgage that was taken out on this home.
Original Mortgage
$106,443
Interest Rate
6.22%
Mortgage Type
New Conventional
Purchase Details
Closed on
Jun 1, 2004
Purchase Details
Closed on
Mar 1, 2000
Purchase Details
Closed on
Dec 1, 1979
Create a Home Valuation Report for This Property
The Home Valuation Report is an in-depth analysis detailing your home's value as well as a comparison with similar homes in the area
Home Values in the Area
Average Home Value in this Area
Purchase History
| Date | Buyer | Sale Price | Title Company |
|---|---|---|---|
| Byrum Ricky Dale | -- | -- | |
| Byrum Ricky Dale | -- | -- | |
| -- | -- | -- | |
| -- | $7,500 | -- | |
| -- | -- | -- |
Source: Public Records
Mortgage History
| Date | Status | Borrower | Loan Amount |
|---|---|---|---|
| Previous Owner | Byrum Ricky Dale | $106,443 |
Source: Public Records
Tax History Compared to Growth
Tax History
| Year | Tax Paid | Tax Assessment Tax Assessment Total Assessment is a certain percentage of the fair market value that is determined by local assessors to be the total taxable value of land and additions on the property. | Land | Improvement |
|---|---|---|---|---|
| 2024 | $1,070 | $71,242 | $10,000 | $61,242 |
| 2023 | $995 | $61,771 | $10,000 | $51,771 |
| 2022 | $829 | $51,768 | $6,400 | $45,368 |
| 2021 | $832 | $46,866 | $6,400 | $40,466 |
| 2020 | $812 | $43,941 | $6,400 | $37,541 |
| 2019 | $755 | $40,624 | $5,200 | $35,424 |
| 2018 | $763 | $40,591 | $5,200 | $35,391 |
| 2017 | $717 | $38,080 | $3,120 | $34,960 |
| 2016 | $732 | $37,661 | $3,120 | $34,541 |
| 2015 | $671 | $36,438 | $2,880 | $33,558 |
| 2014 | $662 | $35,314 | $2,880 | $32,434 |
| 2013 | -- | $35,686 | $2,880 | $32,806 |
Source: Public Records
Map
Nearby Homes
- 148 Swan Sanders Rd
- 0 N Point Cir Unit 7663006
- 0 N Point Cir Unit CL341402
- 0 N Point Cir Unit 10621414
- 479 N Point Cir
- 2868 Mount Hebron Rd
- 247 N Point Cir
- 251 N Point Cir
- 1343 New Hope Church Rd
- 330 Ivy Trail
- 366 Curt Bailey Rd
- 220 Tuscarora Trail
- LOT E2 Nylah Ln
- LOT E1 Nylah Ln
- 0 Sunflower Dr Unit 10590900
- 0 Curt Bailey Rd Unit 10576459
- 0 Curt Bailey Rd Unit 10575247
- 40 Crest Dr Unit 24
- 36 Crest Dr Unit Lot 23
- 123 Carlota Way
- 356 Red Leaf Rd
- 280 Red Leaf Rd
- 204 Redleaf Rd Unit LOT 12
- 236 Redleaf Rd Unit LOT 10
- 271 Red Leaf Rd
- 388 Red Leaf Rd
- 250 Red Leaf Rd
- 385 Red Leaf Rd
- 173 Red Leaf Rd
- 141 Red Leaf Rd
- 4955 Reed Creek Hwy
- 111 Red Leaf Rd
- 160 Red Leaf Rd
- 0 Cartee Johnson Rd
- 427 Red Leaf Rd
- 138 Red Leaf Rd
- 460 Red Leaf Rd
- 106 Red Leaf Rd
- 79 Red Leaf Rd
- 447 Red Leaf Rd