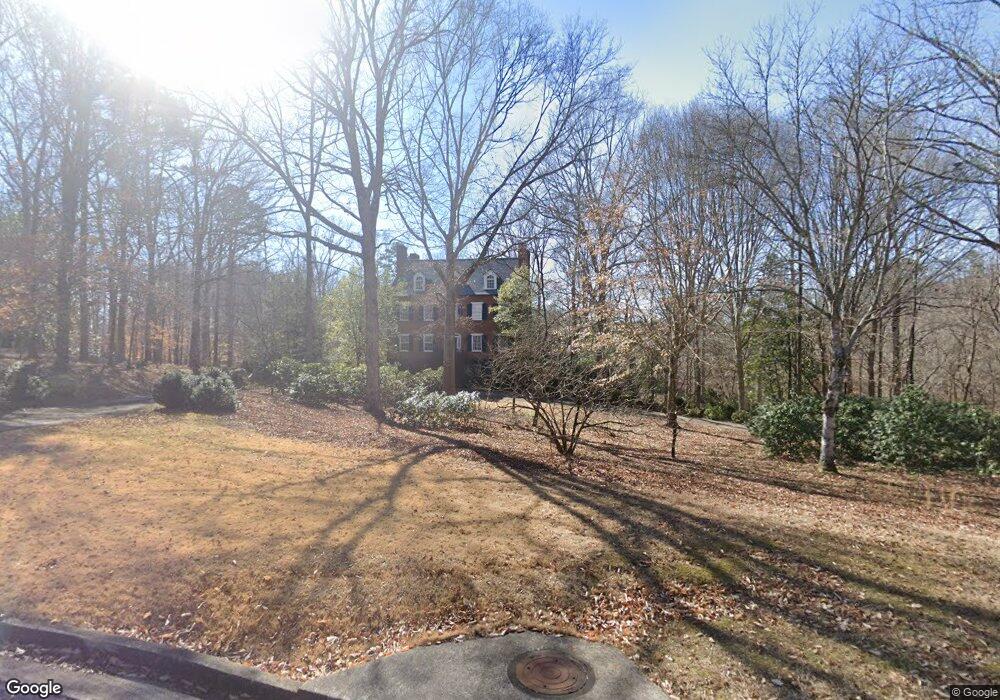
320 Red Oak Trail Athens, GA 30606
Estimated Value: $640,000 - $1,545,000
6
Beds
5
Baths
5,032
Sq Ft
$226/Sq Ft
Est. Value
About This Home
This home is located at 320 Red Oak Trail, Athens, GA 30606 and is currently estimated at $1,134,984, approximately $225 per square foot. 320 Red Oak Trail is a home located in Clarke County with nearby schools including Oglethorpe Avenue Elementary School, Burney-Harris-Lyons Middle School, and Clarke Central High School.
Ownership History
Date
Name
Owned For
Owner Type
Purchase Details
Closed on
Jan 31, 2007
Sold by
Not Provided
Bought by
Hajduk Stephen L and Hajduk Ann S
Current Estimated Value
Home Financials for this Owner
Home Financials are based on the most recent Mortgage that was taken out on this home.
Original Mortgage
$369,500
Outstanding Balance
$220,329
Interest Rate
6.08%
Mortgage Type
New Conventional
Estimated Equity
$914,655
Purchase Details
Closed on
Jun 1, 2006
Sold by
Not Provided
Bought by
Hajduk Stephen L and Hajduk Ann S
Home Financials for this Owner
Home Financials are based on the most recent Mortgage that was taken out on this home.
Original Mortgage
$677,600
Interest Rate
6.51%
Mortgage Type
New Conventional
Purchase Details
Closed on
Jul 14, 1999
Sold by
Mansfield Michael F
Bought by
Morrow Bruce W and Morrow Cynthia P
Purchase Details
Closed on
Aug 9, 1995
Sold by
Payne Norma M
Bought by
Mansfield Michael F
Create a Home Valuation Report for This Property
The Home Valuation Report is an in-depth analysis detailing your home's value as well as a comparison with similar homes in the area
Home Values in the Area
Average Home Value in this Area
Purchase History
| Date | Buyer | Sale Price | Title Company |
|---|---|---|---|
| Hajduk Stephen L | $719,500 | -- | |
| Hajduk Stephen L | $710,000 | -- | |
| Morrow Bruce W | $630,000 | -- | |
| Mansfield Michael F | $595,000 | -- |
Source: Public Records
Mortgage History
| Date | Status | Borrower | Loan Amount |
|---|---|---|---|
| Open | Hajduk Stephen L | $369,500 | |
| Previous Owner | Hajduk Stephen L | $677,600 |
Source: Public Records
Tax History Compared to Growth
Tax History
| Year | Tax Paid | Tax Assessment Tax Assessment Total Assessment is a certain percentage of the fair market value that is determined by local assessors to be the total taxable value of land and additions on the property. | Land | Improvement |
|---|---|---|---|---|
| 2024 | $11,165 | $444,470 | $139,709 | $304,761 |
| 2023 | $11,249 | $430,271 | $139,709 | $290,562 |
| 2022 | $11,008 | $390,310 | $139,709 | $250,601 |
| 2021 | $12,342 | $363,535 | $139,709 | $223,826 |
| 2020 | $10,963 | $354,151 | $139,709 | $214,442 |
| 2019 | $10,950 | $347,108 | $131,947 | $215,161 |
| 2018 | $10,600 | $322,231 | $120,952 | $201,279 |
| 2017 | $10,606 | $322,389 | $120,952 | $201,437 |
| 2016 | $9,584 | $292,288 | $120,951 | $171,336 |
| 2015 | $8,753 | $267,434 | $92,492 | $174,942 |
| 2014 | $8,780 | $267,829 | $92,492 | $175,336 |
Source: Public Records
Map
Nearby Homes
- 240 Deerfield Rd
- 112 Deerhollow Rd
- 215 Claystone Trace
- 190 W Huntington Rd
- 100 Hanover Dr
- 240 W Huntington Rd
- 595 Vaughn Rd
- 115 Melbourne Dr
- 575 Vaughn Rd
- 125 Deerfield Rd
- 212 Huntington Shoals Dr
- 500 Cleveland Rd
- 141 Huntington Shoals Dr
- 116 Laurel Springs Dr
- 637 Huntington Rd Unit B1
- 360 Heather Cove
- 256 Cherokee Ridge
- 139 Lake Forest Dr
- 470 Huntington Rd Unit 5
- 325 Red Oak Trail
- 315 Red Oak Trail
- 305 Red Oak Trail
- 300 Red Oak Trail
- 295 Red Oak Trail
- 216 Deerhill Dr
- 280 Red Oak Trail
- 210 Red Oak Trail
- 0 Red Oak Trail Unit 8441422
- 0 Red Oak Trail Unit 8616114
- 0 Red Oak Trail Unit 2609297
- 210 Deerhill Dr
- 285 Red Oak Trail
- 206 Deerhill Dr
- 270 Red Oak Trail
- 222 Deerhill Dr
- 219 Deerhill Dr
- 200 Red Oak Trail
- 202 Deerhill Dr
- 275 Red Oak Trail