
Seller's Agent in 2017
Edna Kimble
C21/Wright Real Estate
(918) 274-0406
690 Total Sales
Estimated Value: $171,615 - $198,000
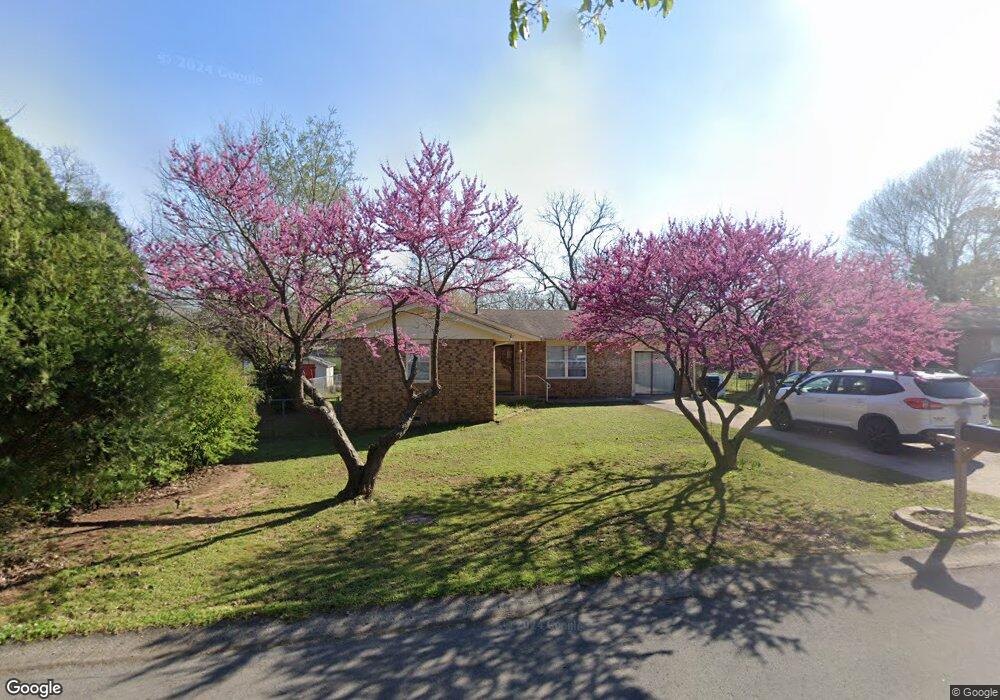
THIS 1514 SQ. FT. (PER CH) BRICK HOME HAS 3 BEDROOMS, 2 BATHS, FLEXIBLE FLOOR PLAN. COULD BE A 4 BEDROOM OR 2 LIVING AREAS! NEW INTERIOR & EXTERIOR PAINT, NEW ROOF. FENCED YARD. SPACIOUS FLOOR PLAN. NEW LINOLEUM FLOORING. NEW CENTRAL HEAT & CIRCUIT BOX.
Last Agent to Sell the Property
C21/Wright Real Estate License #142172 Listed on: 01/02/2017
| Date | Event | Price | List to Sale | Price per Sq Ft |
|---|---|---|---|---|
| 04/14/2017 04/14/17 | Sold | $102,000 | -2.9% | $67 / Sq Ft |
| 12/30/2016 12/30/16 | Pending | -- | -- | -- |
| 12/30/2016 12/30/16 | For Sale | $105,000 | -- | $69 / Sq Ft |
| Year | Tax Paid | Tax Assessment Tax Assessment Total Assessment is a certain percentage of the fair market value that is determined by local assessors to be the total taxable value of land and additions on the property. | Land | Improvement |
|---|---|---|---|---|
| 2025 | $1,057 | $10,864 | $2,750 | $8,114 |
| 2024 | $1,057 | $11,155 | $2,750 | $8,405 |
| 2023 | $1,057 | $11,861 | $1,650 | $10,211 |
| 2022 | $1,100 | $11,861 | $1,650 | $10,211 |
| 2021 | $1,097 | $11,781 | $1,586 | $10,195 |
| 2020 | $1,064 | $11,220 | $1,136 | $10,084 |
| 2019 | $1,054 | $11,220 | $1,136 | $10,084 |
| 2018 | $1,067 | $11,220 | $1,136 | $10,084 |
| 2017 | $552 | $5,815 | $567 | $5,248 |
| 2016 | $529 | $5,538 | $540 | $4,998 |
| 2015 | $473 | $5,275 | $556 | $4,719 |
| 2014 | $473 | $5,023 | $247 | $4,776 |
Seller's Agent in 2017
Edna Kimble
C21/Wright Real Estate
(918) 274-0406
690 Total Sales
Source: MLS Technology
MLS Number: 1700008
APN: 3360-00-004-011-0-000-00
Disclaimer: Certain information contained herein is derived from information provided by parties other than Homes.com. All information provided is deemed reliable, but is not guaranteed to be accurate and should be independently verified.
![]() IDX information is provided exclusively for personal, non-commercial use, and may not be used for any purpose other than to identify prospective properties consumers may be interested in purchasing.
IDX information is provided exclusively for personal, non-commercial use, and may not be used for any purpose other than to identify prospective properties consumers may be interested in purchasing.
Information is deemed reliable but not guaranteed.