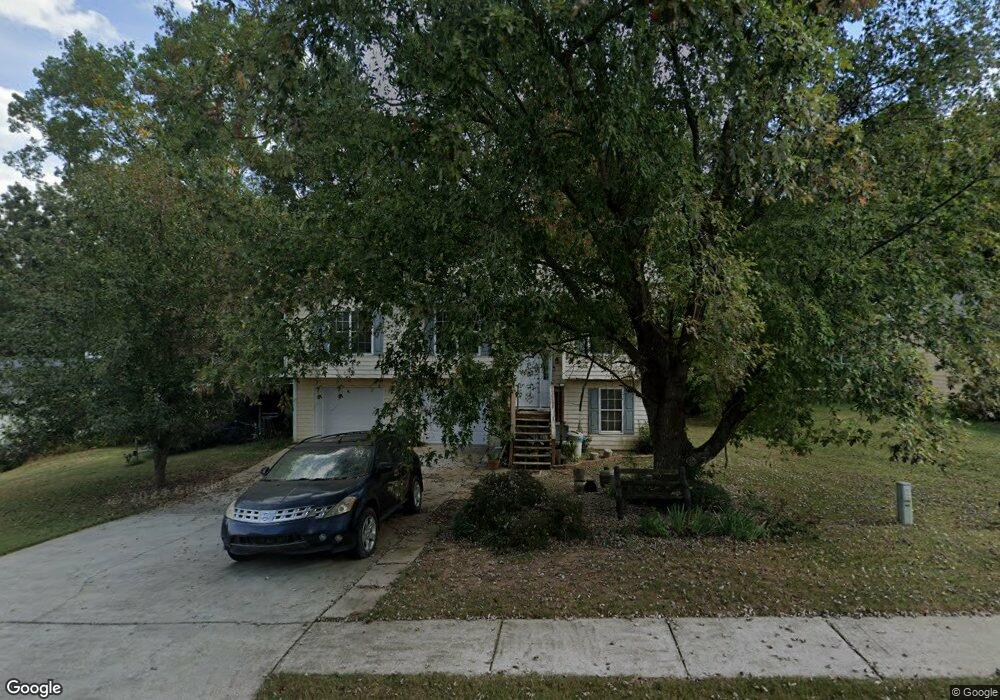
320 Reisling Dr Braselton, GA 30517
Estimated Value: $329,000 - $338,000
2
Beds
3
Baths
1,829
Sq Ft
$182/Sq Ft
Est. Value
About This Home
This home is located at 320 Reisling Dr, Braselton, GA 30517 and is currently estimated at $332,088, approximately $181 per square foot. 320 Reisling Dr is a home located in Jackson County with nearby schools including West Jackson Elementary School, West Jackson Middle School, and Jackson County High School.
Ownership History
Date
Name
Owned For
Owner Type
Purchase Details
Closed on
Nov 19, 2012
Sold by
Kabage Kim Nguyet Thi
Bought by
Kabage Kim Nguyet Thi
Current Estimated Value
Home Financials for this Owner
Home Financials are based on the most recent Mortgage that was taken out on this home.
Original Mortgage
$114,370
Outstanding Balance
$67,420
Interest Rate
3.4%
Mortgage Type
New Conventional
Estimated Equity
$264,668
Purchase Details
Closed on
Jun 30, 2005
Sold by
Foster Judith A
Bought by
Ninh Kim Nguyet Thi
Home Financials for this Owner
Home Financials are based on the most recent Mortgage that was taken out on this home.
Original Mortgage
$129,000
Interest Rate
5.54%
Mortgage Type
New Conventional
Purchase Details
Closed on
Jun 6, 1996
Bought by
Foster Troy E and Foster Judi
Create a Home Valuation Report for This Property
The Home Valuation Report is an in-depth analysis detailing your home's value as well as a comparison with similar homes in the area
Home Values in the Area
Average Home Value in this Area
Purchase History
| Date | Buyer | Sale Price | Title Company |
|---|---|---|---|
| Kabage Kim Nguyet Thi | -- | -- | |
| Ninh Kim Nguyet Thi | $129,000 | -- | |
| Foster Troy E | $87,900 | -- |
Source: Public Records
Mortgage History
| Date | Status | Borrower | Loan Amount |
|---|---|---|---|
| Open | Kabage Kim Nguyet Thi | $114,370 | |
| Previous Owner | Ninh Kim Nguyet Thi | $129,000 |
Source: Public Records
Tax History Compared to Growth
Tax History
| Year | Tax Paid | Tax Assessment Tax Assessment Total Assessment is a certain percentage of the fair market value that is determined by local assessors to be the total taxable value of land and additions on the property. | Land | Improvement |
|---|---|---|---|---|
| 2024 | $2,693 | $96,880 | $22,200 | $74,680 |
| 2023 | $2,693 | $87,080 | $22,200 | $64,880 |
| 2022 | $2,391 | $76,440 | $22,200 | $54,240 |
| 2021 | $2,146 | $68,200 | $13,960 | $54,240 |
| 2020 | $1,734 | $51,160 | $10,000 | $41,160 |
| 2019 | $1,765 | $51,160 | $10,000 | $41,160 |
| 2018 | $1,710 | $49,200 | $10,000 | $39,200 |
| 2017 | $1,653 | $47,281 | $10,000 | $37,281 |
| 2016 | $1,507 | $43,092 | $9,200 | $33,892 |
| 2015 | $1,513 | $43,092 | $9,200 | $33,892 |
| 2014 | $1,325 | $38,664 | $9,200 | $29,464 |
| 2013 | -- | $40,446 | $10,000 | $30,446 |
Source: Public Records
Map
Nearby Homes
- 156 Reisling Dr
- 0 Lewis Braselton Blvd Unit 10646660
- 498 Walnut Woods Dr
- 651 Walnut Woods Dr
- 691 Walnut Woods Dr
- 1030 Glenwyck Dr
- 1145 Glenwyck Dr
- Yosemite Plan at Crossvine Estates - Maple Street Collection
- Jensen Plan at Crossvine Estates - Maple Street Collection
- Fairfax Plan at Crossvine Estates - Maple Street Collection
- Breckenridge Plan at Crossvine Estates - Maple Street Collection
- 533 Traminer Way
- Greenbriar Plan at Crossvine Estates - Maple Street Collection
- Wesley Plan at Crossvine Estates - Maple Street Collection
- 536 Traminer Way
- 931 Walnut Woods Dr
- 880 Duck Rd
- 5455 Highway 53
- 21 Duck Rd
- 225 Hickory Grove Ln
- 330 Reisling Dr
- 312 Reisling Dr
- 306 Reisling Dr
- 303 Reisling Dr
- 329 Reisling Dr
- 298 Reisling Dr Unit 298
- 298 Reisling Dr
- 570 Chardonnay Trace
- 284 Reisling Dr
- 265 Reisling Dr
- 390 Reisling Dr
- 218 Brookstone Trail
- 214 Brookstone Trail
- 210 Brookstone Trail
- 270 Reisling Dr
- 383 Reisling Dr
- 206 Brookstone Trail
- 220 Brookstone Trail Unit ID1254412P
- 251 Reisling Dr
- 550 Chardonnay Trace