Estimated Value: $72,000 - $167,000
3
Beds
2
Baths
1,464
Sq Ft
$79/Sq Ft
Est. Value
About This Home
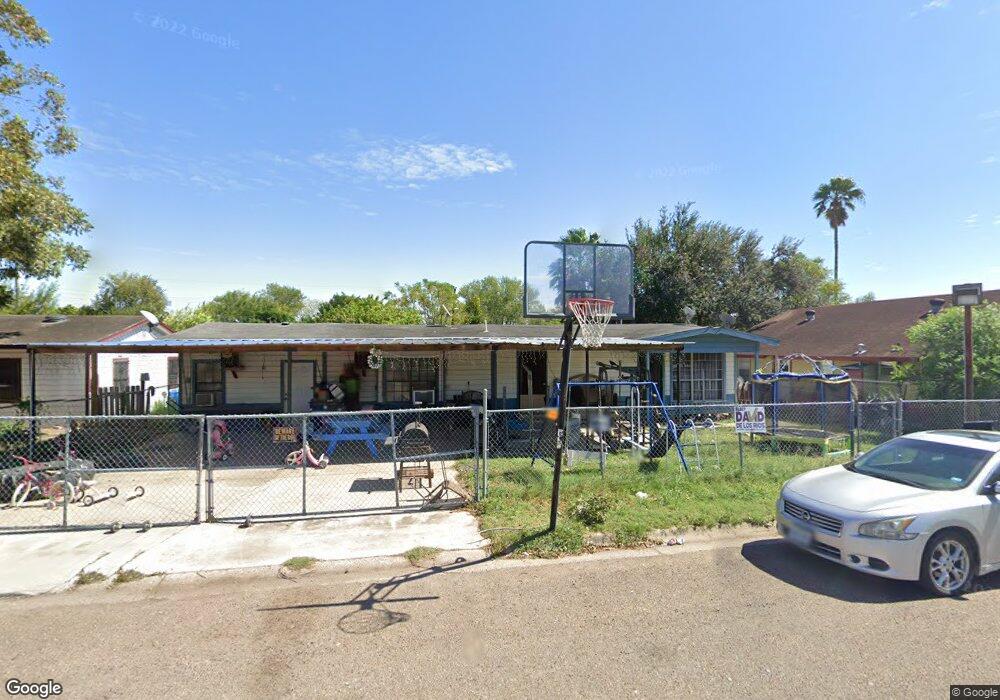
This home is located at 320 S 17th St, Donna, TX 78537 and is currently estimated at $115,824, approximately $79 per square foot. 320 S 17th St is a home located in Hidalgo County with nearby schools including Guzman Elementary School, W.A. Todd Middle School, and Donna High School.
Ownership History
Date
Name
Owned For
Owner Type
Purchase Details
Closed on
Mar 18, 2019
Sold by
Girasol Development Group Llc
Bought by
Alvarado Ricardo and Chapa Zurishadai
Current Estimated Value
Home Financials for this Owner
Home Financials are based on the most recent Mortgage that was taken out on this home.
Original Mortgage
$100,000
Outstanding Balance
$87,738
Interest Rate
4.3%
Mortgage Type
New Conventional
Estimated Equity
$28,086
Purchase Details
Closed on
Jan 20, 2014
Sold by
Alvarado Roberto
Bought by
Alvarado Rolando and Alvarado Ricardo
Purchase Details
Closed on
Nov 3, 2009
Sold by
Alvarado Roberto and Alvarado Gloria
Bought by
Alvarado Roberto and Alvarado Rolando
Create a Home Valuation Report for This Property
The Home Valuation Report is an in-depth analysis detailing your home's value as well as a comparison with similar homes in the area
Home Values in the Area
Average Home Value in this Area
Purchase History
| Date | Buyer | Sale Price | Title Company |
|---|---|---|---|
| Alvarado Ricardo | -- | None Available | |
| Alvarado Rolando | -- | None Available | |
| Alvarado Roberto | -- | None Available |
Source: Public Records
Mortgage History
| Date | Status | Borrower | Loan Amount |
|---|---|---|---|
| Open | Alvarado Ricardo | $100,000 |
Source: Public Records
Tax History Compared to Growth
Tax History
| Year | Tax Paid | Tax Assessment Tax Assessment Total Assessment is a certain percentage of the fair market value that is determined by local assessors to be the total taxable value of land and additions on the property. | Land | Improvement |
|---|---|---|---|---|
| 2025 | $460 | $56,604 | -- | -- |
| 2024 | $460 | $51,458 | -- | -- |
| 2023 | $1,231 | $46,780 | $0 | $0 |
| 2022 | $1,179 | $42,527 | $0 | $0 |
| 2021 | $1,090 | $38,661 | $15,750 | $34,387 |
| 2020 | $1,026 | $35,146 | $14,400 | $23,186 |
| 2019 | $946 | $31,951 | $13,050 | $18,901 |
| 2018 | $952 | $32,085 | $13,050 | $19,035 |
| 2017 | $1,018 | $32,220 | $13,050 | $19,170 |
| 2016 | $920 | $29,125 | $10,125 | $19,000 |
| 2015 | $765 | $29,193 | $10,125 | $19,068 |
Source: Public Records
Map
Nearby Homes