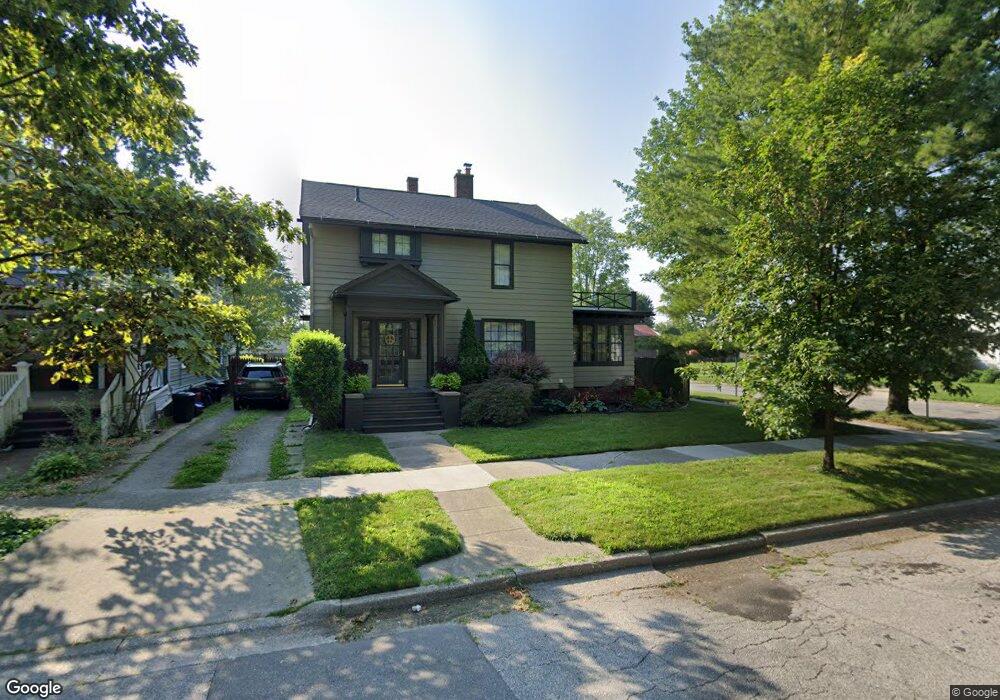
320 S Granger St Saginaw, MI 48602
Heritage Square NeighborhoodEstimated Value: $87,000 - $118,000
3
Beds
2
Baths
1,836
Sq Ft
$58/Sq Ft
Est. Value
About This Home
This home is located at 320 S Granger St, Saginaw, MI 48602 and is currently estimated at $106,699, approximately $58 per square foot. 320 S Granger St is a home located in Saginaw County with nearby schools including Herig Elementary School, Thompson Middle School, and Arthur Hill High School.
Ownership History
Date
Name
Owned For
Owner Type
Purchase Details
Closed on
Nov 22, 2002
Sold by
Mccallum Robin H
Bought by
Bolt Adam B
Current Estimated Value
Home Financials for this Owner
Home Financials are based on the most recent Mortgage that was taken out on this home.
Original Mortgage
$66,201
Interest Rate
6.23%
Mortgage Type
FHA
Purchase Details
Closed on
Nov 7, 2001
Sold by
Overbey Lochie Belle
Bought by
Mccallum Robin H
Purchase Details
Closed on
Aug 16, 1985
Sold by
Ledtke Steven and Kathryn Kavanaugh
Bought by
Overbey Lochie Belle
Purchase Details
Closed on
Aug 1, 1985
Sold by
Ledtke Steven A and Kathryn K-
Bought by
Overbey Lochie Belle
Purchase Details
Closed on
Aug 8, 1980
Sold by
Ognisanti Ognisanti E and Ognisanti Patricia C
Bought by
Ledtke Steven A and Kathryn K-
Purchase Details
Closed on
Jul 29, 1980
Sold by
Ward George E and Ward Mary M
Bought by
Ognisanti Ognisanti E and Ognisanti Patricia C
Create a Home Valuation Report for This Property
The Home Valuation Report is an in-depth analysis detailing your home's value as well as a comparison with similar homes in the area
Home Values in the Area
Average Home Value in this Area
Purchase History
| Date | Buyer | Sale Price | Title Company |
|---|---|---|---|
| Bolt Adam B | $66,700 | -- | |
| Bolt Adam B | $66,725 | Multiple | |
| Mccallum Robin H | $15,000 | -- | |
| Overbey Lochie Belle | $38,500 | -- | |
| Overbey Lochie Belle | $38,500 | -- | |
| Ledtke Steven A | $41,000 | -- | |
| Ognisanti Ognisanti E | -- | -- |
Source: Public Records
Mortgage History
| Date | Status | Borrower | Loan Amount |
|---|---|---|---|
| Previous Owner | Bolt Adam B | $66,201 |
Source: Public Records
Tax History Compared to Growth
Tax History
| Year | Tax Paid | Tax Assessment Tax Assessment Total Assessment is a certain percentage of the fair market value that is determined by local assessors to be the total taxable value of land and additions on the property. | Land | Improvement |
|---|---|---|---|---|
| 2025 | $1,472 | $52,200 | $0 | $0 |
| 2024 | $1,117 | $45,700 | $0 | $0 |
| 2023 | $1,076 | $37,400 | $0 | $0 |
| 2022 | $1,355 | $32,400 | $0 | $0 |
| 2021 | $1,263 | $27,500 | $0 | $0 |
| 2020 | $1,103 | $24,700 | $0 | $0 |
| 2019 | $1,092 | $21,600 | $1,100 | $20,500 |
| 2018 | $846 | $22,859 | $0 | $0 |
| 2017 | $1,108 | $24,000 | $0 | $0 |
| 2016 | $1,098 | $23,615 | $0 | $0 |
| 2014 | -- | $24,548 | $0 | $23,448 |
| 2013 | -- | $25,481 | $0 | $0 |
Source: Public Records
Map
Nearby Homes
- 800 Mackinaw St
- 311 S Porter St
- 1508/1516 & 1509/151 S Fayette & S Michigan St
- 125 S Webster St
- 403 S Fayette St
- 1118 Cass St
- 1203 Mackinaw St
- 129 S Oakley St
- 616 S Oakley St
- 1003 Hancock St
- 203 N Webster St
- 1315 Adams St
- 1014 Hancock St
- 1323 Mackinaw St
- 703 S Mason St
- 803 S Oakley St
- 310 S Bates St
- 129 N Mason St
- 1420 Adams St
- 914 S Harrison St
- 316 S Granger St
- 808 Van Buren St
- 312 S Granger St
- 821 Van Buren St
- 817 Van Buren St
- 321 S Granger St
- 313 S Granger St
- 403 S Granger St
- 302 S Granger St
- 315 S Webster St
- 802 Van Buren St
- 421 S Webster St
- 809 Van Buren St
- 309 S Webster St
- 407 S Granger St
- 809 Cass St
- 803 Van Buren St
- 303 S Granger St
- 413 S Granger St
- 416 S Granger St