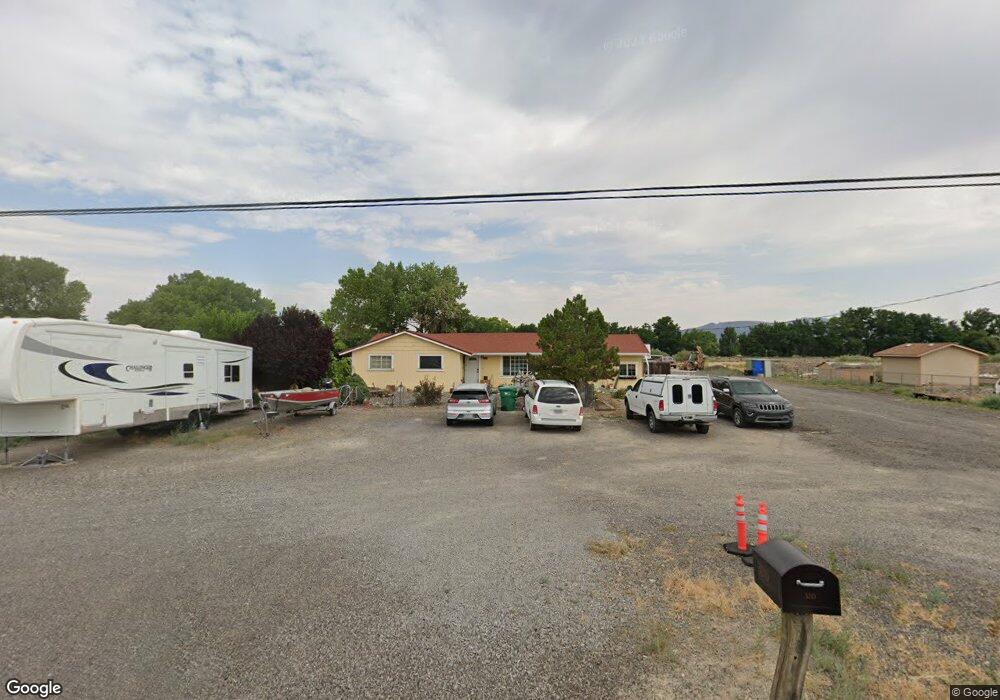
320 Sage St Fernley, NV 89408
Estimated Value: $216,000 - $423,000
3
Beds
2
Baths
1,296
Sq Ft
$263/Sq Ft
Est. Value
About This Home
This home is located at 320 Sage St, Fernley, NV 89408 and is currently estimated at $341,367, approximately $263 per square foot. 320 Sage St is a home with nearby schools including Fernley Elementary School, Fernley Intermediate School, and Fernley High School.
Ownership History
Date
Name
Owned For
Owner Type
Purchase Details
Closed on
Aug 18, 2021
Sold by
Evans Charlie G and Evans Joanne N
Bought by
Fagundes Wendy Ann
Current Estimated Value
Home Financials for this Owner
Home Financials are based on the most recent Mortgage that was taken out on this home.
Original Mortgage
$114,400
Interest Rate
2.2%
Mortgage Type
New Conventional
Create a Home Valuation Report for This Property
The Home Valuation Report is an in-depth analysis detailing your home's value as well as a comparison with similar homes in the area
Home Values in the Area
Average Home Value in this Area
Purchase History
| Date | Buyer | Sale Price | Title Company |
|---|---|---|---|
| Fagundes Wendy Ann | -- | Ticor Title | |
| Fagundes Wendy Ann | $143,000 | Ticor Title Fernley |
Source: Public Records
Mortgage History
| Date | Status | Borrower | Loan Amount |
|---|---|---|---|
| Previous Owner | Fagundes Wendy Ann | $114,400 |
Source: Public Records
Tax History Compared to Growth
Tax History
| Year | Tax Paid | Tax Assessment Tax Assessment Total Assessment is a certain percentage of the fair market value that is determined by local assessors to be the total taxable value of land and additions on the property. | Land | Improvement |
|---|---|---|---|---|
| 2025 | $1,000 | $64,180 | $43,750 | $20,430 |
| 2024 | $1,380 | $63,927 | $43,750 | $20,176 |
| 2023 | $1,380 | $62,257 | $43,750 | $18,507 |
| 2022 | $1,316 | $60,866 | $43,750 | $17,116 |
| 2021 | $1,208 | $52,295 | $35,000 | $17,295 |
| 2020 | $1,179 | $52,756 | $35,000 | $17,756 |
| 2018 | $1,155 | $52,723 | $35,000 | $17,723 |
| 2017 | $1,164 | $28,710 | $10,500 | $18,210 |
| 2016 | $989 | $24,188 | $7,880 | $16,308 |
| 2015 | $1,027 | $23,047 | $7,880 | $15,167 |
| 2014 | $1,005 | $22,760 | $7,880 | $14,880 |
Source: Public Records
Map
Nearby Homes