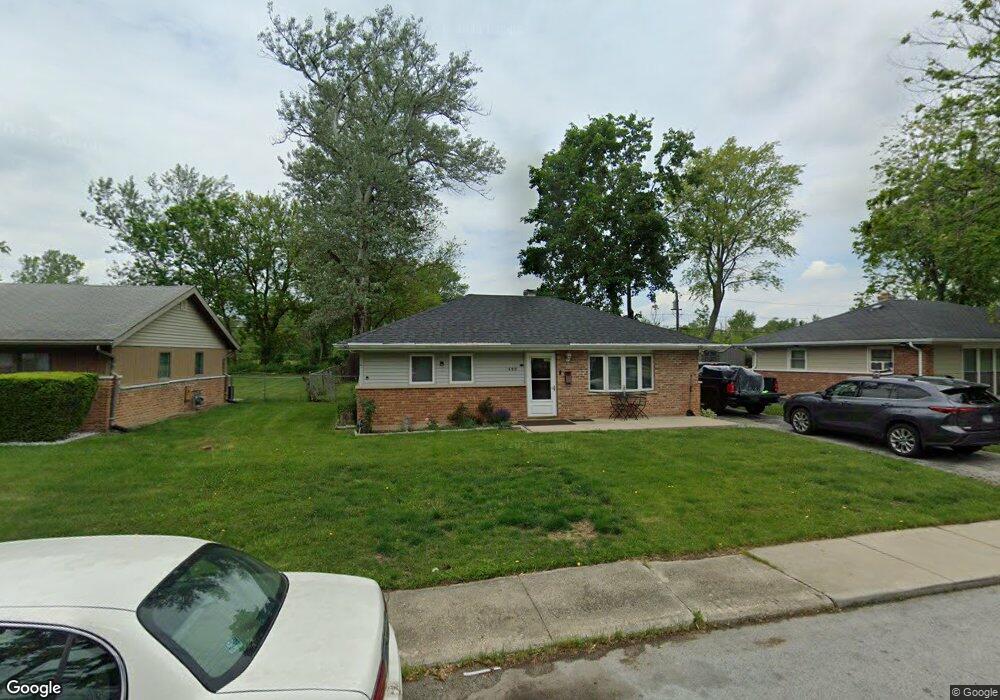
320 Sangamon St Park Forest, IL 60466
Estimated Value: $121,000 - $149,000
2
Beds
1
Bath
949
Sq Ft
$138/Sq Ft
Est. Value
About This Home
This home is located at 320 Sangamon St, Park Forest, IL 60466 and is currently estimated at $130,683, approximately $137 per square foot. 320 Sangamon St is a home located in Cook County with nearby schools including Mohawk Primary Center, Michelle Obama School of Technology, and Barack Obama School of Leadership and STEM.
Ownership History
Date
Name
Owned For
Owner Type
Purchase Details
Closed on
May 6, 2010
Sold by
Ford Justin L
Bought by
Ford Dana L
Current Estimated Value
Purchase Details
Closed on
Sep 29, 2006
Sold by
Ford Dana M and Ford Justin L
Bought by
Ford Justin L and Ford Dana M
Purchase Details
Closed on
Jun 8, 2004
Sold by
Manthei Gary and Manthei Gail
Bought by
Ford Dana M
Home Financials for this Owner
Home Financials are based on the most recent Mortgage that was taken out on this home.
Original Mortgage
$76,415
Outstanding Balance
$41,168
Interest Rate
7.55%
Mortgage Type
Unknown
Estimated Equity
$89,515
Purchase Details
Closed on
Nov 12, 1993
Sold by
Wydra Karen S and Raebel Karol
Bought by
Manthei Gary and Manthei Gail
Home Financials for this Owner
Home Financials are based on the most recent Mortgage that was taken out on this home.
Original Mortgage
$48,000
Interest Rate
8.25%
Create a Home Valuation Report for This Property
The Home Valuation Report is an in-depth analysis detailing your home's value as well as a comparison with similar homes in the area
Home Values in the Area
Average Home Value in this Area
Purchase History
| Date | Buyer | Sale Price | Title Company |
|---|---|---|---|
| Ford Dana L | -- | None Available | |
| Ford Justin L | -- | None Available | |
| Ford Dana M | $90,000 | Pntn | |
| Manthei Gary | $42,000 | -- |
Source: Public Records
Mortgage History
| Date | Status | Borrower | Loan Amount |
|---|---|---|---|
| Open | Ford Dana M | $76,415 | |
| Previous Owner | Manthei Gary | $48,000 | |
| Closed | Ford Dana M | $13,485 |
Source: Public Records
Tax History Compared to Growth
Tax History
| Year | Tax Paid | Tax Assessment Tax Assessment Total Assessment is a certain percentage of the fair market value that is determined by local assessors to be the total taxable value of land and additions on the property. | Land | Improvement |
|---|---|---|---|---|
| 2024 | $6,357 | $12,000 | $2,452 | $9,548 |
| 2023 | -- | $12,000 | $2,452 | $9,548 |
| 2022 | $0 | $3,421 | $2,277 | $1,144 |
| 2021 | $118 | $3,420 | $2,276 | $1,144 |
| 2020 | $382 | $3,420 | $2,276 | $1,144 |
| 2019 | $1,996 | $5,263 | $2,101 | $3,162 |
| 2018 | $1,917 | $5,263 | $2,101 | $3,162 |
| 2017 | $1,968 | $5,263 | $2,101 | $3,162 |
| 2016 | $3,398 | $5,915 | $1,926 | $3,989 |
| 2015 | $3,198 | $5,915 | $1,926 | $3,989 |
| 2014 | $3,156 | $5,915 | $1,926 | $3,989 |
| 2013 | $2,702 | $5,828 | $1,926 | $3,902 |
Source: Public Records
Map
Nearby Homes
- 316 Sangamon St
- 317 Sangamon St
- 312 Sangamon St
- 311 Seneca St
- 263 Sangamon St
- 301 Seneca St
- 22646 Lawndale Ave
- 329 Blackhawk Dr
- 256 Sangamon St
- 257 Miami St
- 321 Shawnee St
- 323 Shawnee St
- 443 Shabbona Dr
- 339 Shabbona Dr
- 254 Blackhawk Dr
- 252 Blackhawk Dr
- 317 Mohawk St
- 304 Somonauk St
- 240 Miami St
- 332 Mohawk St
- 322 Sangamon St
- 324 Sangamon St
- 315 Sangamon St
- 326 Sangamon St
- 314 Sangamon St
- 319 Sangamon St
- 313 Sangamon St
- 321 Sangamon St
- 311 Sangamon St
- 328 Sangamon St
- 323 Sangamon St
- 309 Sangamon St
- 312 Sauganash St
- 314 Sauganash St
- 310 Sauganash St
- 310 Sangamon St
- 330 Sangamon St
- 325 Sangamon St
- 316 Sauganash St