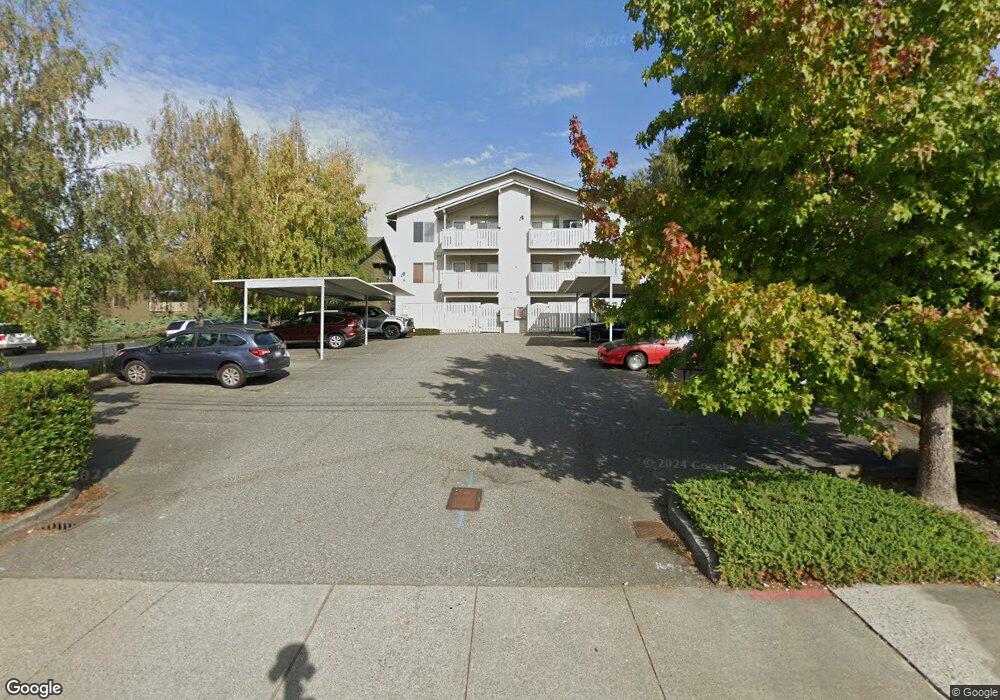
320 SE Barrington Dr Oak Harbor, WA 98277
Estimated Value: $285,938 - $315,000
2
Beds
2
Baths
947
Sq Ft
$317/Sq Ft
Est. Value
About This Home
This home is located at 320 SE Barrington Dr, Oak Harbor, WA 98277 and is currently estimated at $299,985, approximately $316 per square foot. 320 SE Barrington Dr is a home located in Island County with nearby schools including Oak Harbor Elementary School, North Whidbey Middle School, and Oak Harbor High School.
Ownership History
Date
Name
Owned For
Owner Type
Purchase Details
Closed on
Dec 18, 2016
Sold by
Sanders Amanda
Bought by
Sanders Christopher A
Current Estimated Value
Home Financials for this Owner
Home Financials are based on the most recent Mortgage that was taken out on this home.
Original Mortgage
$104,250
Outstanding Balance
$84,010
Interest Rate
3.54%
Mortgage Type
New Conventional
Estimated Equity
$215,975
Purchase Details
Closed on
Dec 9, 2016
Sold by
Everett Donald
Bought by
Sanders Christopher A
Home Financials for this Owner
Home Financials are based on the most recent Mortgage that was taken out on this home.
Original Mortgage
$104,250
Outstanding Balance
$84,010
Interest Rate
3.54%
Mortgage Type
New Conventional
Estimated Equity
$215,975
Purchase Details
Closed on
Dec 9, 2003
Sold by
Dennis Lynn L and Dennis Lynn E
Bought by
Everett Donald
Create a Home Valuation Report for This Property
The Home Valuation Report is an in-depth analysis detailing your home's value as well as a comparison with similar homes in the area
Home Values in the Area
Average Home Value in this Area
Purchase History
| Date | Buyer | Sale Price | Title Company |
|---|---|---|---|
| Sanders Christopher A | -- | Premier Title | |
| Sanders Christopher A | $139,000 | Premier Title Of Island | |
| Everett Donald | $92,000 | Land Title Co Island Co |
Source: Public Records
Mortgage History
| Date | Status | Borrower | Loan Amount |
|---|---|---|---|
| Open | Sanders Christopher A | $104,250 |
Source: Public Records
Tax History Compared to Growth
Tax History
| Year | Tax Paid | Tax Assessment Tax Assessment Total Assessment is a certain percentage of the fair market value that is determined by local assessors to be the total taxable value of land and additions on the property. | Land | Improvement |
|---|---|---|---|---|
| 2025 | $2,360 | $275,771 | $100,000 | $175,771 |
| 2024 | $2,284 | $277,983 | $100,000 | $177,983 |
| 2023 | $2,284 | $270,491 | $100,000 | $170,491 |
| 2022 | $1,963 | $231,429 | $75,000 | $156,429 |
| 2021 | $1,786 | $182,832 | $45,000 | $137,832 |
| 2020 | $1,660 | $165,806 | $32,000 | $133,806 |
| 2019 | $1,581 | $152,451 | $60,000 | $92,451 |
| 2018 | $1,146 | $157,733 | $65,000 | $92,733 |
| 2017 | $1,088 | $100,624 | $12,750 | $87,874 |
| 2016 | $1,144 | $101,720 | $12,750 | $88,970 |
| 2015 | $1,179 | $102,814 | $12,750 | $90,064 |
| 2013 | -- | $105,003 | $12,750 | $92,253 |
Source: Public Records
Map
Nearby Homes
- 270 SE Barrington Dr Unit A-304
- 476 SE Barrington Dr Unit E
- 0 SE Bayshore Dr Unit NWM2377102
- 651 SE Bayshore Dr Unit B304
- 651 SE Bayshore Dr Unit E101
- 651 SE Bayshore Dr Unit E102
- 583 SE 6th Ave
- 427 SE Ely St
- 945 SE Pioneer Way
- 280 SW Ballast Way
- 185 SW 3rd Ave
- 485 SW Bayshore Dr Unit C201
- 161 W Whidbey Ave Unit 4
- 161 W Whidbey Ave Unit 26
- 1475 SE 9th Ave Unit All
- 1850 SW Scenic Heights St Unit B304
- 1101 SW Harrier Cir Unit 106
- 30901 State Route 20 Unit D2
- 39974 State Route 20
- 726 E Whidbey Ave
- 320 SE Barrington Dr Unit A201
- 320 SE Barrington Dr Unit B201
- 320 SE Barrington Dr Unit D
- 320 SE Barrington Dr Unit A
- 320 SE Barrington Dr Unit F
- 320 SE Barrington Dr Unit E
- 320 SE Barrington Dr Unit B
- 320 SE Barrington Dr Unit G
- 320 SE Barrington Dr Unit A101
- 320 SE Barrington Dr Unit H
- 320 SE Barrington Dr Unit A102
- 320 SE Barrington Dr Unit A202
- 320 SE Barrington Dr Unit B101
- 380 SE Barrington Dr
- 1049 SE City Beach St
- 270 SE Barrington Dr Unit A303
- 270 SE Barrington Dr Unit A206
- 270 SE Barrington Dr Unit A306
- 270 SE Barrington Dr Unit B-104
- 270 SE Barrington Dr Unit A305