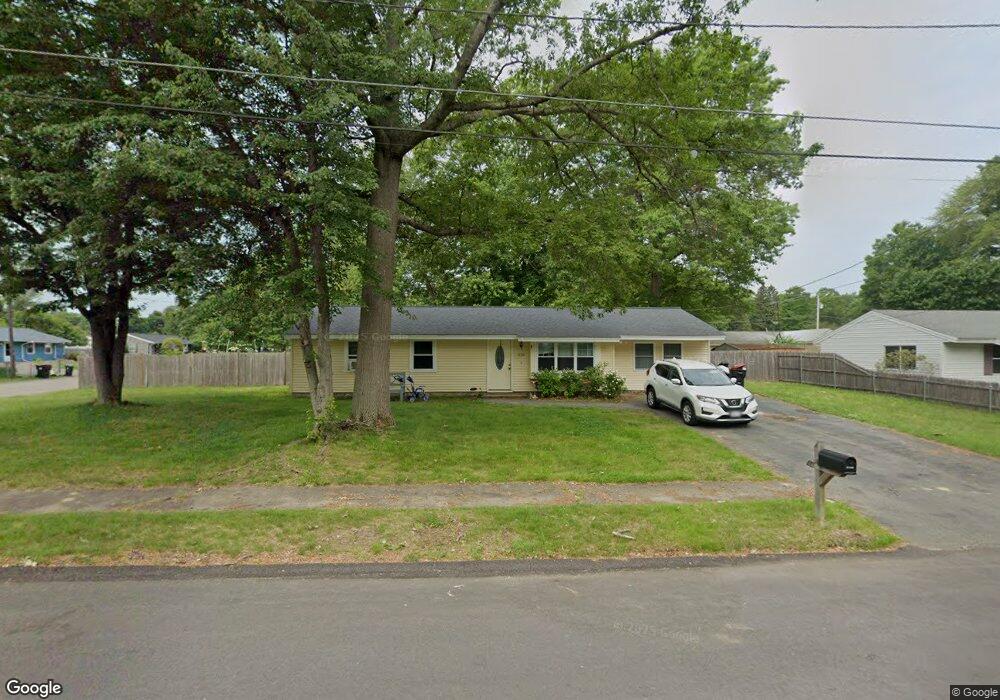
320 Southfield Dr Brockton, MA 02302
Estimated Value: $468,000 - $509,313
4
Beds
1
Bath
1,440
Sq Ft
$337/Sq Ft
Est. Value
About This Home
This home is located at 320 Southfield Dr, Brockton, MA 02302 and is currently estimated at $484,578, approximately $336 per square foot. 320 Southfield Dr is a home located in Plymouth County with nearby schools including Davis K-8 School, John F. Kennedy Elementary School, and South Middle School.
Ownership History
Date
Name
Owned For
Owner Type
Purchase Details
Closed on
Aug 14, 2023
Sold by
Oconnell Amanda A and Oconnell Scott F
Bought by
Hopkins Zachery and Hopkins Samantha
Current Estimated Value
Home Financials for this Owner
Home Financials are based on the most recent Mortgage that was taken out on this home.
Original Mortgage
$369,562
Outstanding Balance
$360,244
Interest Rate
6.71%
Mortgage Type
Purchase Money Mortgage
Estimated Equity
$124,334
Purchase Details
Closed on
Feb 4, 2016
Sold by
Oconnell Scott F
Bought by
Oconnell Scott F and Oconnell Amanda A
Purchase Details
Closed on
Mar 12, 2004
Sold by
Trask Frederick
Bought by
Oconnell Scott F
Home Financials for this Owner
Home Financials are based on the most recent Mortgage that was taken out on this home.
Original Mortgage
$189,000
Interest Rate
5.67%
Mortgage Type
Purchase Money Mortgage
Purchase Details
Closed on
Aug 18, 1998
Sold by
Reddington Gary F and Reddington Phyllis A
Bought by
Trask Chester R
Purchase Details
Closed on
Jul 15, 1988
Sold by
Oneil Dennis F
Bought by
Reddington Gary F
Home Financials for this Owner
Home Financials are based on the most recent Mortgage that was taken out on this home.
Original Mortgage
$107,000
Interest Rate
10.57%
Mortgage Type
Purchase Money Mortgage
Create a Home Valuation Report for This Property
The Home Valuation Report is an in-depth analysis detailing your home's value as well as a comparison with similar homes in the area
Home Values in the Area
Average Home Value in this Area
Purchase History
| Date | Buyer | Sale Price | Title Company |
|---|---|---|---|
| Hopkins Zachery | $410,000 | None Available | |
| Oconnell Scott F | -- | -- | |
| Oconnell Scott F | $210,000 | -- | |
| Trask Chester R | $93,000 | -- | |
| Reddington Gary F | $119,000 | -- |
Source: Public Records
Mortgage History
| Date | Status | Borrower | Loan Amount |
|---|---|---|---|
| Open | Hopkins Zachery | $369,562 | |
| Previous Owner | Reddington Gary F | $215,000 | |
| Previous Owner | Reddington Gary F | $189,000 | |
| Previous Owner | Reddington Gary F | $95,000 | |
| Previous Owner | Reddington Gary F | $107,000 |
Source: Public Records
Tax History Compared to Growth
Tax History
| Year | Tax Paid | Tax Assessment Tax Assessment Total Assessment is a certain percentage of the fair market value that is determined by local assessors to be the total taxable value of land and additions on the property. | Land | Improvement |
|---|---|---|---|---|
| 2025 | $4,739 | $391,300 | $161,100 | $230,200 |
| 2024 | $4,529 | $376,800 | $161,100 | $215,700 |
| 2023 | $4,364 | $336,200 | $111,500 | $224,700 |
| 2022 | $4,030 | $288,500 | $101,300 | $187,200 |
| 2021 | $4,022 | $277,400 | $94,400 | $183,000 |
| 2020 | $3,930 | $259,400 | $82,700 | $176,700 |
| 2019 | $3,622 | $233,100 | $79,000 | $154,100 |
| 2018 | $3,402 | $211,800 | $79,000 | $132,800 |
| 2017 | $2,861 | $177,700 | $79,000 | $98,700 |
| 2016 | $3,090 | $178,000 | $75,400 | $102,600 |
| 2015 | $2,755 | $151,800 | $75,400 | $76,400 |
| 2014 | $2,868 | $158,200 | $75,400 | $82,800 |
Source: Public Records
Map
Nearby Homes