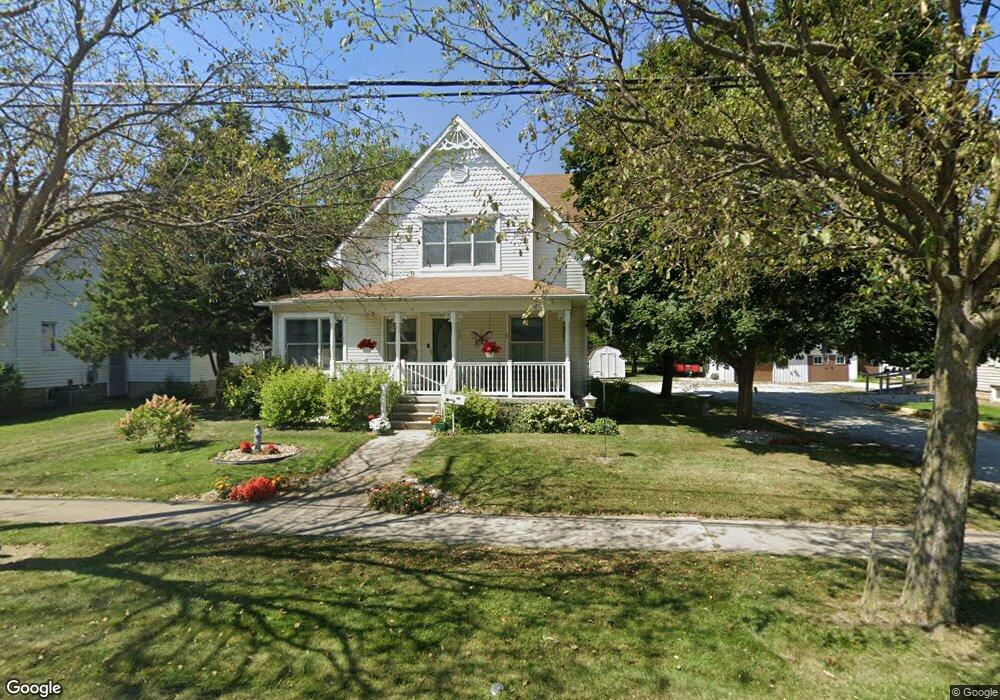
320 Stryker St Archbold, OH 43502
Estimated Value: $161,000 - $204,639
4
Beds
2
Baths
2,001
Sq Ft
$96/Sq Ft
Est. Value
About This Home
This home is located at 320 Stryker St, Archbold, OH 43502 and is currently estimated at $191,160, approximately $95 per square foot. 320 Stryker St is a home located in Fulton County with nearby schools including Archbold Elementary School, Archbold Middle School, and Archbold High School.
Ownership History
Date
Name
Owned For
Owner Type
Purchase Details
Closed on
Nov 27, 2023
Sold by
Werder Bruce R
Bought by
Irrevocable Trust and Carroll
Current Estimated Value
Purchase Details
Closed on
Jan 1, 1990
Bought by
Werder Bruce R
Create a Home Valuation Report for This Property
The Home Valuation Report is an in-depth analysis detailing your home's value as well as a comparison with similar homes in the area
Home Values in the Area
Average Home Value in this Area
Purchase History
| Date | Buyer | Sale Price | Title Company |
|---|---|---|---|
| Irrevocable Trust | -- | None Listed On Document | |
| Werder Bruce R | -- | -- |
Source: Public Records
Tax History
| Year | Tax Paid | Tax Assessment Tax Assessment Total Assessment is a certain percentage of the fair market value that is determined by local assessors to be the total taxable value of land and additions on the property. | Land | Improvement |
|---|---|---|---|---|
| 2024 | $1,610 | $40,950 | $8,680 | $32,270 |
| 2023 | $1,610 | $40,950 | $8,680 | $32,270 |
| 2022 | $1,239 | $34,130 | $7,250 | $26,880 |
| 2021 | $1,241 | $34,130 | $7,250 | $26,880 |
| 2020 | $1,235 | $34,130 | $7,250 | $26,880 |
| 2019 | $1,041 | $29,160 | $7,250 | $21,910 |
| 2018 | $924 | $29,160 | $7,250 | $21,910 |
| 2017 | $897 | $29,160 | $7,250 | $21,910 |
| 2016 | $895 | $27,170 | $7,250 | $19,920 |
| 2015 | $784 | $27,170 | $7,250 | $19,920 |
| 2014 | $784 | $27,170 | $7,250 | $19,920 |
| 2013 | $851 | $27,830 | $5,600 | $22,230 |
Source: Public Records
Map
Nearby Homes
- 408 Ditto St
- 328 W Lutz Rd Unit 328
- 301 N Pointe Dr
- 0 Lafayette St
- 404 Murbach St
- 226 Burke St
- 808 West St
- 552 Quail Run
- 1808 S Defiance St
- 224 Hawthorn Dr
- 3514 Gaslight Dr
- 21530 County Road A
- V-526 Co Rd 25
- 4427 County Road 19
- 17830 County Road C
- 200 Tyler Ln
- 301 Horton St
- 23161 County Road Jk
- 22227 Us Highway 20a
- 20095 County Road H50
- 322 Stryker St
- 318 Stryker St
- 0 Eicher St
- 2 Eicher St
- 400 Stryker St
- 319 Stryker St
- 321 Stryker St
- 3 Eicher St
- 402 Stryker St
- 314 Stryker St
- 314 Stryker St
- 323 W Holland St
- 319 W Holland St
- 325 W Holland St
- 401 Stryker St
- 401 W Holland St
- 404 Stryker St
- 315 Stryker St
- 317 W Holland St
- 403 W Holland St
Your Personal Tour Guide
Ask me questions while you tour the home.