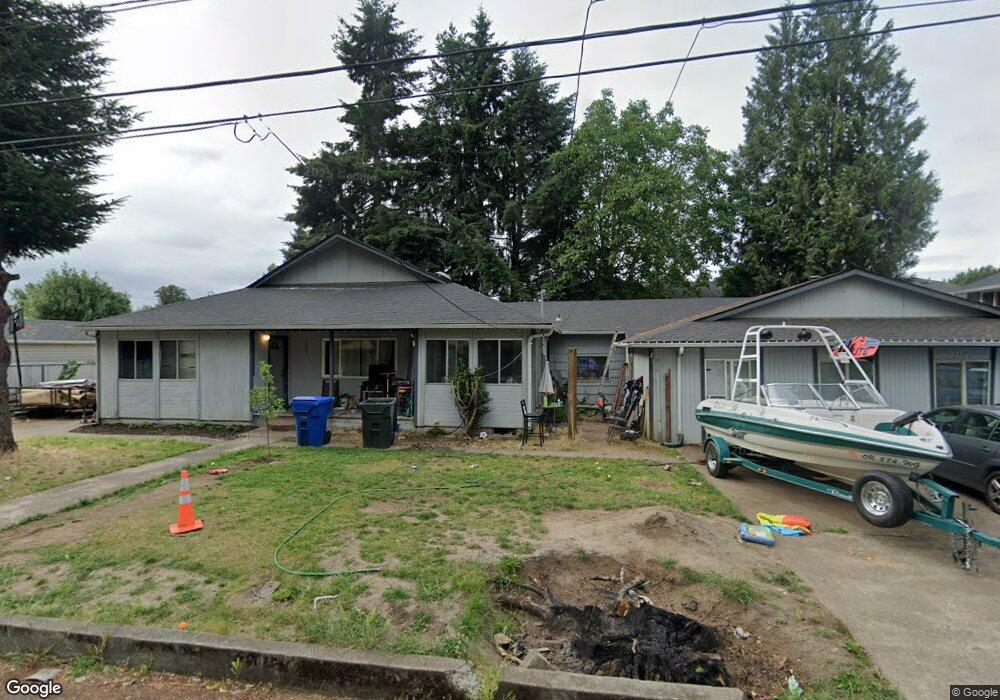
320 Taybin Rd NW Salem, OR 97304
West Salem NeighborhoodEstimated Value: $527,438 - $618,000
6
Beds
4
Baths
2,388
Sq Ft
$239/Sq Ft
Est. Value
About This Home
This home is located at 320 Taybin Rd NW, Salem, OR 97304 and is currently estimated at $571,360, approximately $239 per square foot. 320 Taybin Rd NW is a home located in Polk County with nearby schools including Harritt Elementary School, Walker Middle School, and West Salem High School.
Ownership History
Date
Name
Owned For
Owner Type
Purchase Details
Closed on
Oct 14, 2014
Sold by
Wells Fargo Bank National Association
Bought by
Franco Manuel Q
Current Estimated Value
Purchase Details
Closed on
Jul 28, 2014
Sold by
Romero Juan Carlos and Greenpoint Mortgage Funding In
Bought by
Wells Fargo Bank National Associaton
Purchase Details
Closed on
Jan 14, 2014
Sold by
Romero Juan Carlos and Greenpoint Mortgage Funding In
Bought by
Wells Fargo Bank National Association
Purchase Details
Closed on
Oct 3, 2005
Sold by
Abrams Richard J and Abrams Elsie Mae
Bought by
Romero Juan Carlos
Home Financials for this Owner
Home Financials are based on the most recent Mortgage that was taken out on this home.
Original Mortgage
$200,000
Interest Rate
3%
Mortgage Type
Fannie Mae Freddie Mac
Create a Home Valuation Report for This Property
The Home Valuation Report is an in-depth analysis detailing your home's value as well as a comparison with similar homes in the area
Home Values in the Area
Average Home Value in this Area
Purchase History
| Date | Buyer | Sale Price | Title Company |
|---|---|---|---|
| Franco Manuel Q | $160,125 | None Available | |
| Wells Fargo Bank National Associaton | $170,544 | None Available | |
| Wells Fargo Bank National Association | $170,544 | None Available | |
| Romero Juan Carlos | $250,000 | Amerititle |
Source: Public Records
Mortgage History
| Date | Status | Borrower | Loan Amount |
|---|---|---|---|
| Previous Owner | Romero Juan Carlos | $200,000 |
Source: Public Records
Tax History Compared to Growth
Tax History
| Year | Tax Paid | Tax Assessment Tax Assessment Total Assessment is a certain percentage of the fair market value that is determined by local assessors to be the total taxable value of land and additions on the property. | Land | Improvement |
|---|---|---|---|---|
| 2025 | $4,957 | $270,930 | $60,480 | $210,450 |
| 2024 | $4,957 | $263,040 | $58,710 | $204,330 |
| 2023 | $4,813 | $255,380 | $57,000 | $198,380 |
| 2022 | $4,659 | $247,950 | $55,340 | $192,610 |
| 2021 | $4,526 | $240,730 | $53,720 | $187,010 |
| 2020 | $4,392 | $233,720 | $52,160 | $181,560 |
| 2019 | $4,239 | $226,920 | $50,640 | $176,280 |
| 2018 | $4,168 | $220,320 | $49,160 | $171,160 |
| 2017 | $3,757 | $213,910 | $47,730 | $166,180 |
| 2016 | $3,569 | $204,100 | $61,380 | $142,720 |
| 2015 | -- | $188,920 | $59,800 | $129,120 |
Source: Public Records
Map
Nearby Homes
- 1215 Dorval Ave NW
- 1630 Wallace Rd NW Unit 60
- 1630 Wallace Rd NW Unit 59 Rd NW
- 1630 Wallace Rd NW Unit 4
- 1630 Wallace Rd NW Unit 18
- 1630 Wallace Rd NW Unit 9
- 1748 Salmon River St NW
- 1148 Karen Way NW
- 1050 Cardinal St NW
- 1045 Cardinal St NW Unit 68
- 0 Edgewater & Murlark (Lot Unit 2) 824107
- 0 Edgewater & Murlark (Lot Unit 1) 824106
- 1635 George Ct NW
- 1043 6th St NW
- 388 Market St NE
- 1361 West Way NW
- 1022 Pali Dr NW
- 1565 Liberty St NE
- 1510 Parkway Dr NW
- 1117 6th St NW
- 320 Taybin Rd (-322) NW
- 300 Taybin Rd NW
- 298 Taybin Rd NW
- 357 Glen Creek Rd NW
- 351 Glen Creek Rd NW
- 1124 Cornucopia St NW
- 1124 Cornucopia St NW
- 1124 Cornucopia St NW
- 269 Cameo St NW
- 269 Cameo (-275) St NW
- 285 Cameo St NW
- 305 Cameo St NW
- 315 Cameo St NW
- 325 Cameo St NW
- 271 Cameo St NW
- 335 Cameo St NW
- 345 Cameo St NW
- 1144 Wallace Rd NW
- 1130 Wallace Rd NW
- 1130 Wallace Rd NW