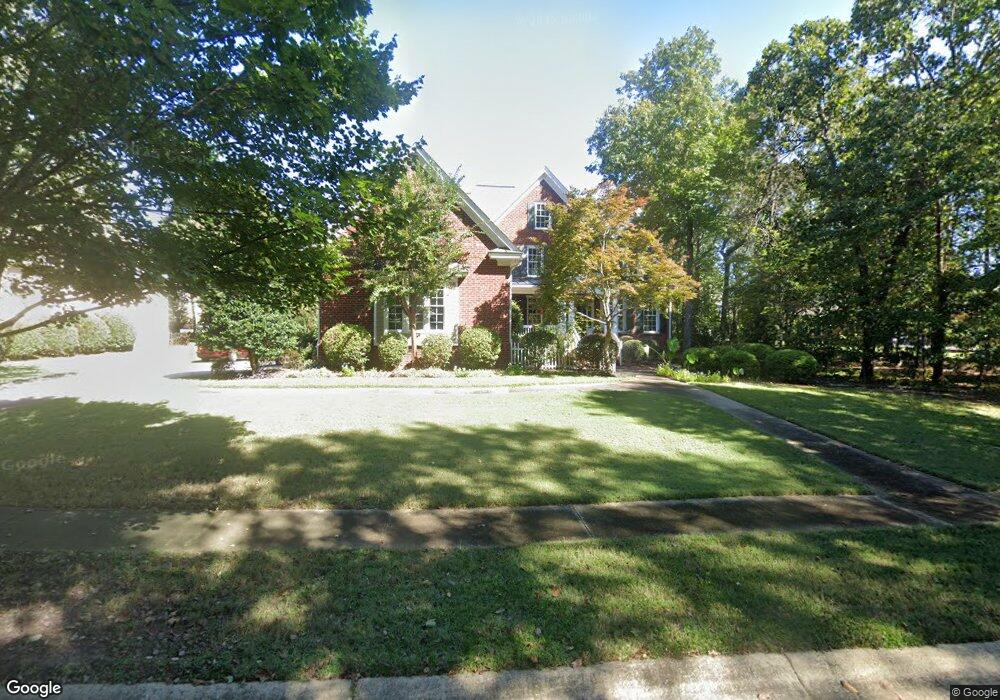
320 Upland Trail Rd Elgin, SC 29045
Pontiac-Elgin NeighborhoodEstimated Value: $639,000 - $689,000
5
Beds
5
Baths
3,792
Sq Ft
$174/Sq Ft
Est. Value
About This Home
This home is located at 320 Upland Trail Rd, Elgin, SC 29045 and is currently estimated at $657,953, approximately $173 per square foot. 320 Upland Trail Rd is a home located in Richland County with nearby schools including Catawba Trail Elementary, Summit Parkway Middle School, and Spring Valley High School.
Ownership History
Date
Name
Owned For
Owner Type
Purchase Details
Closed on
Apr 10, 2017
Sold by
Learmonth George M and Learmonth Nancy L
Bought by
Harris James D and Reid Margaret T
Current Estimated Value
Home Financials for this Owner
Home Financials are based on the most recent Mortgage that was taken out on this home.
Original Mortgage
$232,000
Outstanding Balance
$192,794
Interest Rate
4.16%
Mortgage Type
New Conventional
Estimated Equity
$465,159
Purchase Details
Closed on
Feb 7, 2011
Sold by
Carver Paul A and Carver Lisa A
Bought by
Learmonth George M and Learmonth Nancy L
Home Financials for this Owner
Home Financials are based on the most recent Mortgage that was taken out on this home.
Original Mortgage
$377,482
Interest Rate
4.79%
Mortgage Type
New Conventional
Purchase Details
Closed on
Feb 23, 2005
Sold by
S E Ayers Co Inc
Bought by
Carver Paul A and Carver Lisa A
Home Financials for this Owner
Home Financials are based on the most recent Mortgage that was taken out on this home.
Original Mortgage
$326,400
Interest Rate
4.36%
Mortgage Type
Purchase Money Mortgage
Create a Home Valuation Report for This Property
The Home Valuation Report is an in-depth analysis detailing your home's value as well as a comparison with similar homes in the area
Home Values in the Area
Average Home Value in this Area
Purchase History
| Date | Buyer | Sale Price | Title Company |
|---|---|---|---|
| Harris James D | $392,000 | None Available | |
| Learmonth George M | $397,350 | -- | |
| Carver Paul A | $408,000 | -- |
Source: Public Records
Mortgage History
| Date | Status | Borrower | Loan Amount |
|---|---|---|---|
| Open | Harris James D | $232,000 | |
| Previous Owner | Learmonth George M | $377,482 | |
| Previous Owner | Carver Paul A | $326,400 |
Source: Public Records
Tax History
| Year | Tax Paid | Tax Assessment Tax Assessment Total Assessment is a certain percentage of the fair market value that is determined by local assessors to be the total taxable value of land and additions on the property. | Land | Improvement |
|---|---|---|---|---|
| 2024 | $4,184 | $460,000 | $0 | $0 |
| 2023 | $4,040 | $16,000 | $0 | $0 |
| 2022 | $3,621 | $400,000 | $40,000 | $360,000 |
| 2021 | $3,673 | $16,000 | $0 | $0 |
| 2020 | $3,733 | $16,000 | $0 | $0 |
| 2019 | $3,734 | $16,000 | $0 | $0 |
| 2018 | $3,727 | $15,680 | $0 | $0 |
| 2017 | $3,490 | $14,950 | $0 | $0 |
| 2016 | $3,476 | $14,950 | $0 | $0 |
| 2015 | $3,491 | $14,950 | $0 | $0 |
| 2014 | $3,484 | $373,700 | $0 | $0 |
| 2013 | -- | $14,950 | $0 | $0 |
Source: Public Records
Map
Nearby Homes
- 409 Upland Trail Rd
- 200 Longfield Ln
- 15 Pocosin Ct
- 1235 Beechfern Cir
- 823 Queenshire Ln
- 385 Switch Grass Ct
- 2 Greenside Ln
- 34 Haigler Ct
- 156 Jacobs Mill Pond Rd
- 205 Parish Walk
- 25 Haigler Ct
- 535 Cordgrass Rd
- 320 Switch Grass Ct
- 14 Gillon Ln
- 200 Deer Crossing Rd
- 226 Thacher Loop
- 110 Bolter Ln
- 114 Bolter Ln
- 204 Sapphire Gem Ln
- 204 Deer Crossing Rd
- 316 Upland Trail Rd
- 324 Upland Trail Rd
- 125 Still Wild Ln
- 312 Upland Trail Rd
- 121 Still Wild Ln
- 400 Upland Trail Rd
- 500 Upland Trail Rd
- 504 Upland Trail Rd
- 308 Upland Trail Rd
- 304 Upland Trail Rd
- 117 Still Wild Ln
- 404 Upland Trail Rd
- 113 Still Wild Ln
- 408 Upland Trail Rd
- 100 Upland Trail Rd
- 432 Upland Trail Rd
- 109 Still Wild Ln
- 212 Upland Trail Rd
- 430 Upland Trail Rd
- 418 Upland Trail Rd
Your Personal Tour Guide
Ask me questions while you tour the home.