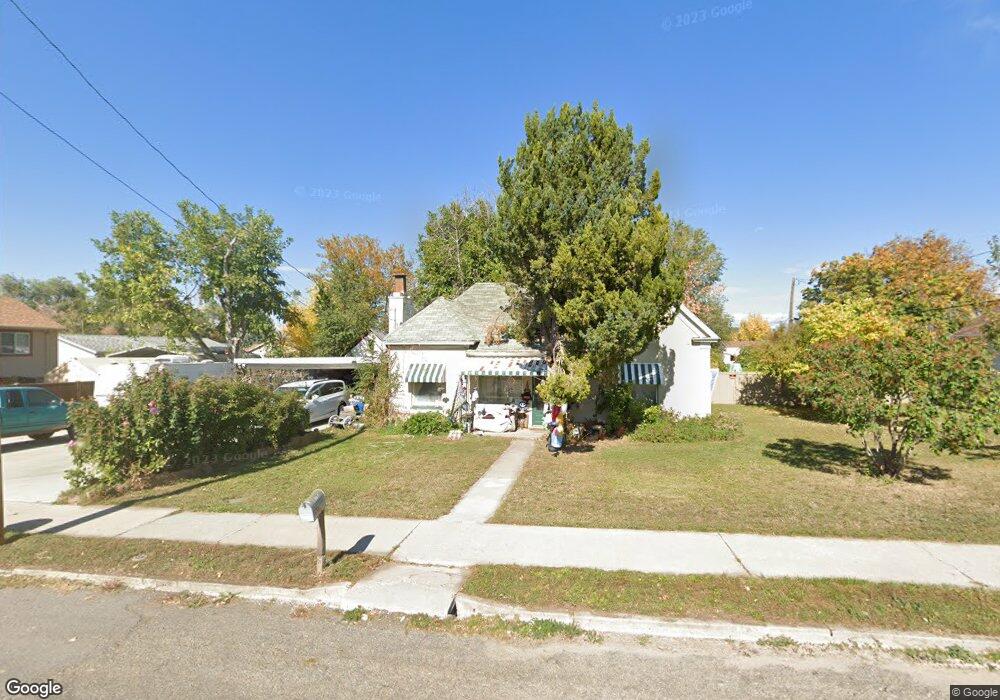
320 W 100 N Payson, UT 84651
Estimated Value: $379,000 - $469,371
3
Beds
1
Bath
1,291
Sq Ft
$323/Sq Ft
Est. Value
About This Home
This home is located at 320 W 100 N, Payson, UT 84651 and is currently estimated at $416,593, approximately $322 per square foot. 320 W 100 N is a home located in Utah County with nearby schools including Taylor Elementary School, Salem Junior High School, and Valley View Middle School.
Ownership History
Date
Name
Owned For
Owner Type
Purchase Details
Closed on
Apr 29, 2014
Sold by
Iolow Willard N and Iolow Joyce L
Bought by
Lake Twyla L
Current Estimated Value
Purchase Details
Closed on
Feb 5, 2014
Sold by
Lake Twyla I
Bought by
Inlow Willaro N and Inlow Joyee L
Purchase Details
Closed on
Feb 21, 2003
Sold by
Lake Twyla L and Lake James B
Bought by
Lake James B and Lake Twyla L
Home Financials for this Owner
Home Financials are based on the most recent Mortgage that was taken out on this home.
Original Mortgage
$115,600
Interest Rate
5.93%
Mortgage Type
FHA
Purchase Details
Closed on
Jul 1, 1999
Sold by
Lake James B and Lake Twyla L
Bought by
Lake James B and Lake Twyla L
Home Financials for this Owner
Home Financials are based on the most recent Mortgage that was taken out on this home.
Original Mortgage
$17,109
Interest Rate
7.2%
Mortgage Type
Stand Alone Second
Create a Home Valuation Report for This Property
The Home Valuation Report is an in-depth analysis detailing your home's value as well as a comparison with similar homes in the area
Home Values in the Area
Average Home Value in this Area
Purchase History
| Date | Buyer | Sale Price | Title Company |
|---|---|---|---|
| Lake Twyla L | -- | None Available | |
| Inlow Willaro N | -- | None Available | |
| Lake James B | -- | Meridian Title Company | |
| Lake James B | -- | Guardian Title Insurance |
Source: Public Records
Mortgage History
| Date | Status | Borrower | Loan Amount |
|---|---|---|---|
| Previous Owner | Lake James B | $115,600 | |
| Previous Owner | Lake James B | $17,109 |
Source: Public Records
Tax History
| Year | Tax Paid | Tax Assessment Tax Assessment Total Assessment is a certain percentage of the fair market value that is determined by local assessors to be the total taxable value of land and additions on the property. | Land | Improvement |
|---|---|---|---|---|
| 2025 | $1,860 | $208,285 | -- | -- |
| 2024 | $1,825 | $189,310 | $0 | $0 |
| 2023 | $1,911 | $186,230 | $0 | $0 |
| 2022 | $1,911 | $191,840 | $0 | $0 |
| 2021 | $1,615 | $260,000 | $108,600 | $151,400 |
| 2020 | $1,283 | $234,800 | $94,400 | $140,400 |
| 2019 | $1,283 | $207,100 | $85,000 | $122,100 |
| 2018 | $1,144 | $178,000 | $71,800 | $106,200 |
| 2017 | $168 | $92,235 | $0 | $0 |
| 2016 | $1,066 | $88,605 | $0 | $0 |
| 2015 | $1,020 | $84,205 | $0 | $0 |
| 2014 | $897 | $74,635 | $0 | $0 |
Source: Public Records
Map
Nearby Homes
Your Personal Tour Guide
Ask me questions while you tour the home.