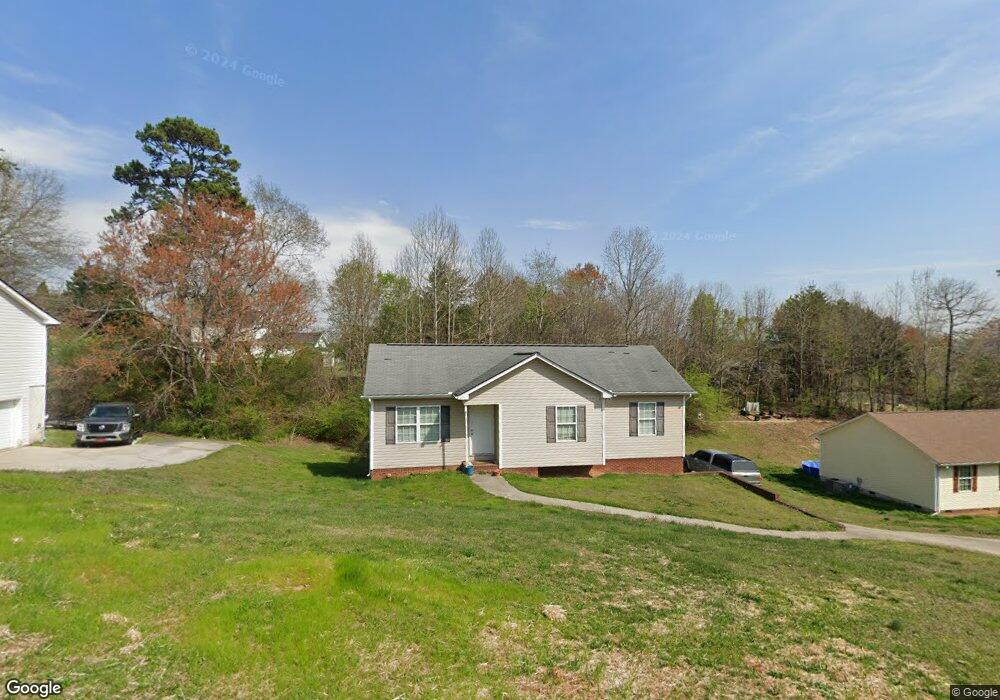
320 Windsong Dr La Fayette, GA 30728
Estimated Value: $209,000 - $242,000
3
Beds
2
Baths
1,437
Sq Ft
$160/Sq Ft
Est. Value
About This Home
This home is located at 320 Windsong Dr, La Fayette, GA 30728 and is currently estimated at $229,769, approximately $159 per square foot. 320 Windsong Dr is a home located in Walker County with nearby schools including North Lafayette Elementary School, Lafayette Middle School, and Lafayette High School.
Ownership History
Date
Name
Owned For
Owner Type
Purchase Details
Closed on
Oct 5, 2018
Sold by
Ray Alvin
Bought by
Ray Tyler Joseph
Current Estimated Value
Home Financials for this Owner
Home Financials are based on the most recent Mortgage that was taken out on this home.
Original Mortgage
$90,909
Outstanding Balance
$79,278
Interest Rate
4.5%
Mortgage Type
New Conventional
Estimated Equity
$150,491
Purchase Details
Closed on
Oct 16, 2009
Sold by
Teems
Bought by
Ray Alvin
Home Financials for this Owner
Home Financials are based on the most recent Mortgage that was taken out on this home.
Original Mortgage
$68,000
Interest Rate
5.04%
Mortgage Type
New Conventional
Purchase Details
Closed on
Dec 2, 2008
Sold by
Not Provided
Bought by
Ray Alvin
Purchase Details
Closed on
Oct 5, 2004
Sold by
Green Oaks Llc
Bought by
New Life Construction Llc
Purchase Details
Closed on
Sep 4, 1998
Bought by
Peavine Land Co Llc
Create a Home Valuation Report for This Property
The Home Valuation Report is an in-depth analysis detailing your home's value as well as a comparison with similar homes in the area
Home Values in the Area
Average Home Value in this Area
Purchase History
| Date | Buyer | Sale Price | Title Company |
|---|---|---|---|
| Ray Tyler Joseph | $90,000 | -- | |
| Ray Alvin | $85,000 | -- | |
| Ray Alvin | -- | -- | |
| New Life Construction Llc | $150,000 | -- | |
| Green Oaks Llc | $149,500 | -- | |
| Peavine Land Co Llc | -- | -- |
Source: Public Records
Mortgage History
| Date | Status | Borrower | Loan Amount |
|---|---|---|---|
| Open | Ray Tyler Joseph | $90,909 | |
| Previous Owner | Ray Alvin | $68,000 |
Source: Public Records
Tax History Compared to Growth
Tax History
| Year | Tax Paid | Tax Assessment Tax Assessment Total Assessment is a certain percentage of the fair market value that is determined by local assessors to be the total taxable value of land and additions on the property. | Land | Improvement |
|---|---|---|---|---|
| 2024 | $1,969 | $82,683 | $4,000 | $78,683 |
| 2023 | $1,879 | $76,533 | $2,200 | $74,333 |
| 2022 | $1,715 | $65,162 | $2,000 | $63,162 |
| 2021 | $1,332 | $45,361 | $2,000 | $43,361 |
| 2020 | $1,101 | $35,893 | $2,000 | $33,893 |
| 2019 | $1,102 | $35,893 | $2,000 | $33,893 |
| 2018 | $1,068 | $35,893 | $2,000 | $33,893 |
| 2017 | $1,134 | $35,893 | $2,000 | $33,893 |
| 2016 | $1,066 | $40,653 | $6,760 | $33,893 |
| 2015 | $1,038 | $37,882 | $6,760 | $31,122 |
| 2014 | $1,000 | $37,882 | $6,760 | $31,122 |
| 2013 | -- | $37,882 | $6,760 | $31,122 |
Source: Public Records
Map
Nearby Homes
- 329 Windsong Dr
- 307 Ridgecrest Dr
- 79 Hobart Ln
- 302 Ridgecrest Dr
- 1118 Probasco St N
- 1876 Old Mineral Springs Rd
- 1303 Campbell Crescent
- 1309 Campbell Crescent
- 393 Wisteria Rd
- 1314 Fernwood Dr
- 1001 N Main St
- 1403 N Main St
- 105 Stanfield Rd
- 307 Park St
- 0 Center St Unit 1517720
- 613 Bradley Ave
- 1520 N Main St
- 111 Dove Dr
- 114 Mallard Ln
- 214 East Ave
- 322 Windsong Dr
- 318 Windsong Dr
- 0 Windsong Dr Unit 1131790
- 0 Windsong Dr Unit 1131788
- 0 Windsong Dr Unit 1131789
- 0 Windsong Dr Unit 1131787
- 0 Windsong Dr Unit 1131786
- 0 Windsong Dr Unit 1168602
- 0 Windsong Dr Unit 8107071
- 0 Windsong Dr Unit 1256359
- 0 Windsong Dr Unit 1051
- 0 Windsong Dr Unit 1070
- 0 Windsong Dr Unit 8722233
- 0 Windsong Dr Unit 3216993
- 23 Ridgecrest Dr
- 28 Windsong Dr
- 27 Windsong Dr
- 36 Windsong Dr
- 35 Windsong Dr
- 34 Windsong Dr