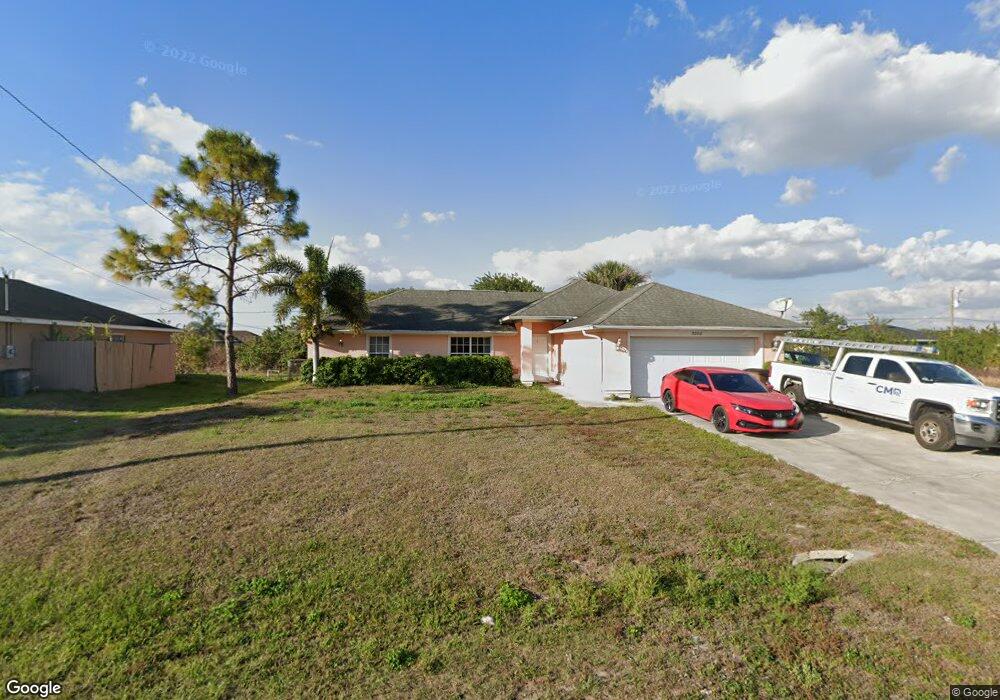
3200 36th St SW Lehigh Acres, FL 33976
Sunshine NeighborhoodEstimated Value: $273,833 - $311,000
3
Beds
2
Baths
1,550
Sq Ft
$188/Sq Ft
Est. Value
About This Home
This home is located at 3200 36th St SW, Lehigh Acres, FL 33976 and is currently estimated at $290,708, approximately $187 per square foot. 3200 36th St SW is a home located in Lee County with nearby schools including Gateway Elementary School, Lehigh Elementary School, and Tice Elementary School.
Ownership History
Date
Name
Owned For
Owner Type
Purchase Details
Closed on
Dec 29, 2009
Sold by
Federal National Mortgage Association
Bought by
Patch Howard T and Patch Mary
Current Estimated Value
Purchase Details
Closed on
Nov 3, 2009
Sold by
Pinheiro Floriano P
Bought by
Federal National Mortgage Association
Purchase Details
Closed on
Mar 18, 2005
Sold by
Gatco Construction Inc
Bought by
Pinheiro Floriano P and Pinheiro Maria E
Home Financials for this Owner
Home Financials are based on the most recent Mortgage that was taken out on this home.
Original Mortgage
$152,800
Interest Rate
6.5%
Mortgage Type
New Conventional
Purchase Details
Closed on
Jun 28, 2004
Sold by
Lewandski Thaddeus F
Bought by
Gatco Construction
Purchase Details
Closed on
Jun 21, 2004
Sold by
Lewandski Thaddeus F
Bought by
Gatco Construction
Create a Home Valuation Report for This Property
The Home Valuation Report is an in-depth analysis detailing your home's value as well as a comparison with similar homes in the area
Home Values in the Area
Average Home Value in this Area
Purchase History
| Date | Buyer | Sale Price | Title Company |
|---|---|---|---|
| Patch Howard T | $61,500 | Attorney | |
| Federal National Mortgage Association | -- | None Available | |
| Pinheiro Floriano P | $191,000 | Safe Harbor Title | |
| Gatco Construction | $9,500 | Safe Harbor Title | |
| Gatco Construction | $9,500 | Safe Harbor Title |
Source: Public Records
Mortgage History
| Date | Status | Borrower | Loan Amount |
|---|---|---|---|
| Previous Owner | Pinheiro Floriano P | $152,800 | |
| Closed | Pinheiro Floriano P | $38,200 |
Source: Public Records
Tax History Compared to Growth
Tax History
| Year | Tax Paid | Tax Assessment Tax Assessment Total Assessment is a certain percentage of the fair market value that is determined by local assessors to be the total taxable value of land and additions on the property. | Land | Improvement |
|---|---|---|---|---|
| 2025 | $3,237 | $202,649 | -- | -- |
| 2024 | $3,237 | $184,226 | -- | -- |
| 2023 | $3,237 | $167,478 | $0 | $0 |
| 2022 | $2,833 | $152,253 | $0 | $0 |
| 2021 | $2,463 | $162,794 | $6,000 | $156,794 |
| 2020 | $2,361 | $152,618 | $5,000 | $147,618 |
| 2019 | $2,292 | $146,163 | $4,700 | $141,463 |
| 2018 | $2,157 | $134,041 | $4,400 | $129,641 |
| 2017 | $2,020 | $121,931 | $3,800 | $118,131 |
| 2016 | $1,853 | $105,194 | $3,800 | $101,394 |
| 2015 | $1,719 | $93,587 | $3,360 | $90,227 |
| 2014 | $1,492 | $78,990 | $2,715 | $76,275 |
| 2013 | -- | $67,902 | $2,700 | $65,202 |
Source: Public Records
Map
Nearby Homes
- 3124 35th St SW
- 3417 37th St SW
- 3216 36th St SW
- 3204 34th St SW
- 2519 38th St SW
- 2509 38th St SW
- 2615 38th St SW
- 3401 38th St SW
- 2507 38th St SW
- 3319 39th St SW
- 2701 39th St SW
- 3611 39th St SW
- 3402 39th St SW
- 3105 Ruth Ave S
- 3508 35th St SW
- 3510 35th St SW
- 3029 35th St SW
- 3117 35th St SW
- 2608 34th St SW
- 3700 34th St SW
- 3202 36th St SW
- 3204 36th St SW
- 3201 36th St SW
- 3203 36th St SW Unit 5
- 3125 35th St SW
- 3125 36th St SW
- 3205 35th St SW
- 3205 36th St SW
- 3120 36th St SW
- 3208 36th St SW
- 3200 35th St SW
- 3202 35th St SW
- 3124 37th St SW
- 3204 35th St SW
- 3118 36th St SW Unit 8
- 3122 37th St SW Unit 9
- 3206 37th St SW
- 3208 37th St SW