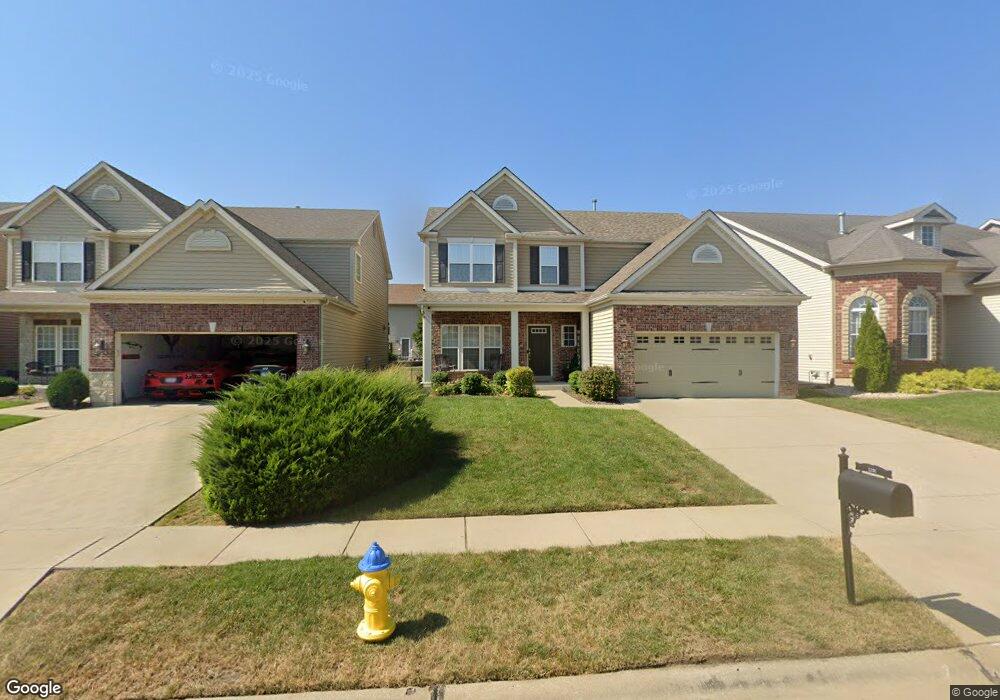
3201 Calhoun Dr Unit 25B Saint Charles, MO 63301
New Town NeighborhoodEstimated Value: $427,000 - $463,000
4
Beds
3
Baths
2,468
Sq Ft
$182/Sq Ft
Est. Value
About This Home
This home is located at 3201 Calhoun Dr Unit 25B, Saint Charles, MO 63301 and is currently estimated at $448,032, approximately $181 per square foot. 3201 Calhoun Dr Unit 25B is a home located in St. Charles County with nearby schools including Discovery Elementary School, Orchard Farm Elementary School, and Orchard Farm Middle School.
Ownership History
Date
Name
Owned For
Owner Type
Purchase Details
Closed on
Sep 28, 2022
Sold by
Weymouth Jeffrey A and Weymouth Ashley M
Bought by
Weymouth Jeffrey A
Current Estimated Value
Home Financials for this Owner
Home Financials are based on the most recent Mortgage that was taken out on this home.
Original Mortgage
$299,000
Outstanding Balance
$285,790
Interest Rate
5.13%
Mortgage Type
New Conventional
Estimated Equity
$162,242
Purchase Details
Closed on
Sep 29, 2014
Sold by
Fischer & Frichtel Custom Homes Llc
Bought by
Weymouth Jeffrey A and Weymouth Ashley M
Home Financials for this Owner
Home Financials are based on the most recent Mortgage that was taken out on this home.
Original Mortgage
$251,655
Interest Rate
4.13%
Mortgage Type
New Conventional
Purchase Details
Closed on
Sep 20, 2013
Sold by
Straqr Properties Llc
Bought by
Fischer & Frichtel Custom Homes Llc
Create a Home Valuation Report for This Property
The Home Valuation Report is an in-depth analysis detailing your home's value as well as a comparison with similar homes in the area
Home Values in the Area
Average Home Value in this Area
Purchase History
| Date | Buyer | Sale Price | Title Company |
|---|---|---|---|
| Weymouth Jeffrey A | -- | Title Partners | |
| Weymouth Jeffrey A | -- | Title Partners | |
| Weymouth Jeffrey A | -- | Title Partners | |
| Weymouth Jeffrey A | -- | None Available | |
| Fischer & Frichtel Custom Homes Llc | $15,000 | Arch City Title |
Source: Public Records
Mortgage History
| Date | Status | Borrower | Loan Amount |
|---|---|---|---|
| Open | Weymouth Jeffrey A | $299,000 | |
| Closed | Weymouth Jeffrey A | $299,000 | |
| Previous Owner | Weymouth Jeffrey A | $251,655 |
Source: Public Records
Tax History Compared to Growth
Tax History
| Year | Tax Paid | Tax Assessment Tax Assessment Total Assessment is a certain percentage of the fair market value that is determined by local assessors to be the total taxable value of land and additions on the property. | Land | Improvement |
|---|---|---|---|---|
| 2025 | $5,004 | $77,764 | -- | -- |
| 2023 | $5,006 | $74,658 | $0 | $0 |
| 2022 | $4,143 | $59,520 | $0 | $0 |
| 2021 | $4,149 | $59,520 | $0 | $0 |
| 2020 | $3,998 | $56,809 | $0 | $0 |
| 2019 | $3,621 | $56,809 | $0 | $0 |
| 2018 | $3,393 | $50,854 | $0 | $0 |
| 2017 | $3,341 | $50,854 | $0 | $0 |
| 2016 | $3,331 | $49,381 | $0 | $0 |
| 2015 | $3,325 | $49,381 | $0 | $0 |
| 2014 | $1,218 | $7,125 | $0 | $0 |
Source: Public Records
Map
Nearby Homes
- 3100 Osterly Bend
- 3101 Flatboat Station
- 3173 Cog Wheel Station
- 3305 Charlestowne Crossing Dr
- 3396 Charlestowne Crossing Dr
- 3353 Steeple Hill
- 3349 Bentwater Place
- 3404 John Lilly St
- 2 Copper Trail Ct
- 3457 Carriage Crossing
- 3419 Banner Place
- 3410 E Lime Kiln Unit A
- 3464 Millington Dr
- 3291 River Breeze Ct
- 3055 Devilla Trail Unit 8B
- 3184 Country Bluff Dr
- 5034 Becks Landing Ln
- 237 E Arpent Way
- 3265 S Civic Green Way
- 3410 Sublette St