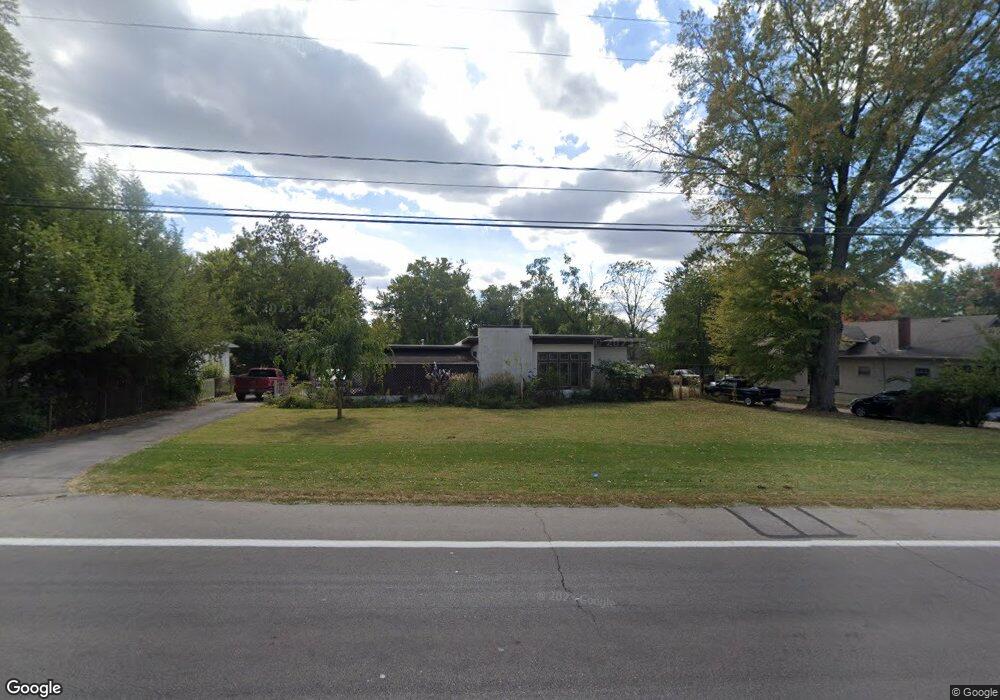
3201 E High St Springfield, OH 45505
Estimated Value: $248,657 - $294,000
3
Beds
2
Baths
1,772
Sq Ft
$153/Sq Ft
Est. Value
About This Home
This home is located at 3201 E High St, Springfield, OH 45505 and is currently estimated at $270,914, approximately $152 per square foot. 3201 E High St is a home located in Clark County with nearby schools including Possum Elementary School, Shawnee Middle School/High School, and Catholic Central Elementary School - Lagonda Campus.
Ownership History
Date
Name
Owned For
Owner Type
Purchase Details
Closed on
Sep 17, 2008
Sold by
Ryan Michael L and Ryan Elizabeth D
Bought by
Netts Terry J
Current Estimated Value
Home Financials for this Owner
Home Financials are based on the most recent Mortgage that was taken out on this home.
Original Mortgage
$100,800
Outstanding Balance
$66,316
Interest Rate
6.55%
Mortgage Type
Purchase Money Mortgage
Estimated Equity
$204,598
Purchase Details
Closed on
Jul 26, 2002
Sold by
Demmien David C and Demmien Kari L
Bought by
Ryan Michael L and Ryan Elizabeth D
Home Financials for this Owner
Home Financials are based on the most recent Mortgage that was taken out on this home.
Original Mortgage
$127,281
Interest Rate
6.7%
Mortgage Type
FHA
Purchase Details
Closed on
Mar 10, 1989
Create a Home Valuation Report for This Property
The Home Valuation Report is an in-depth analysis detailing your home's value as well as a comparison with similar homes in the area
Home Values in the Area
Average Home Value in this Area
Purchase History
| Date | Buyer | Sale Price | Title Company |
|---|---|---|---|
| Netts Terry J | $126,000 | Attorney | |
| Ryan Michael L | $132,000 | -- | |
| -- | $72,000 | -- |
Source: Public Records
Mortgage History
| Date | Status | Borrower | Loan Amount |
|---|---|---|---|
| Open | Netts Terry J | $100,800 | |
| Previous Owner | Ryan Michael L | $127,281 |
Source: Public Records
Tax History
| Year | Tax Paid | Tax Assessment Tax Assessment Total Assessment is a certain percentage of the fair market value that is determined by local assessors to be the total taxable value of land and additions on the property. | Land | Improvement |
|---|---|---|---|---|
| 2025 | $3,195 | $78,810 | $16,940 | $61,870 |
| 2024 | $3,112 | $63,720 | $12,270 | $51,450 |
| 2023 | $3,112 | $63,720 | $12,270 | $51,450 |
| 2022 | $3,087 | $63,720 | $12,270 | $51,450 |
| 2021 | $2,686 | $49,650 | $9,510 | $40,140 |
| 2020 | $2,709 | $49,650 | $9,510 | $40,140 |
| 2019 | $2,751 | $49,650 | $9,510 | $40,140 |
| 2018 | $2,379 | $42,350 | $8,650 | $33,700 |
| 2017 | $2,438 | $42,347 | $8,645 | $33,702 |
| 2016 | $2,199 | $42,347 | $8,645 | $33,702 |
| 2015 | $2,207 | $41,083 | $8,645 | $32,438 |
| 2014 | $2,214 | $41,083 | $8,645 | $32,438 |
| 2013 | $1,923 | $41,083 | $8,645 | $32,438 |
Source: Public Records
Map
Nearby Homes
- 507 Elbron Rd
- 631 Kramer Rd
- 3012 E High St
- 451 Lawnview Ave
- 138 Lawnview Ave
- 2804 Lowman St
- 218 Golden Gate Ave
- 224 Mackinac Dr
- 224 Roebling St
- 2745 Share St
- 2809 Morton Dr
- 1011 Mount Joy St
- 255 S Bird Rd
- 2702 Maplewood Ave
- 2730 E Main St
- 180 Chesapeake Cir
- 115 S Burnett Rd
- 360 Buxton Ave
- 375 N Fostoria Ave
- 374 Raffensperger Ave
Your Personal Tour Guide
Ask me questions while you tour the home.