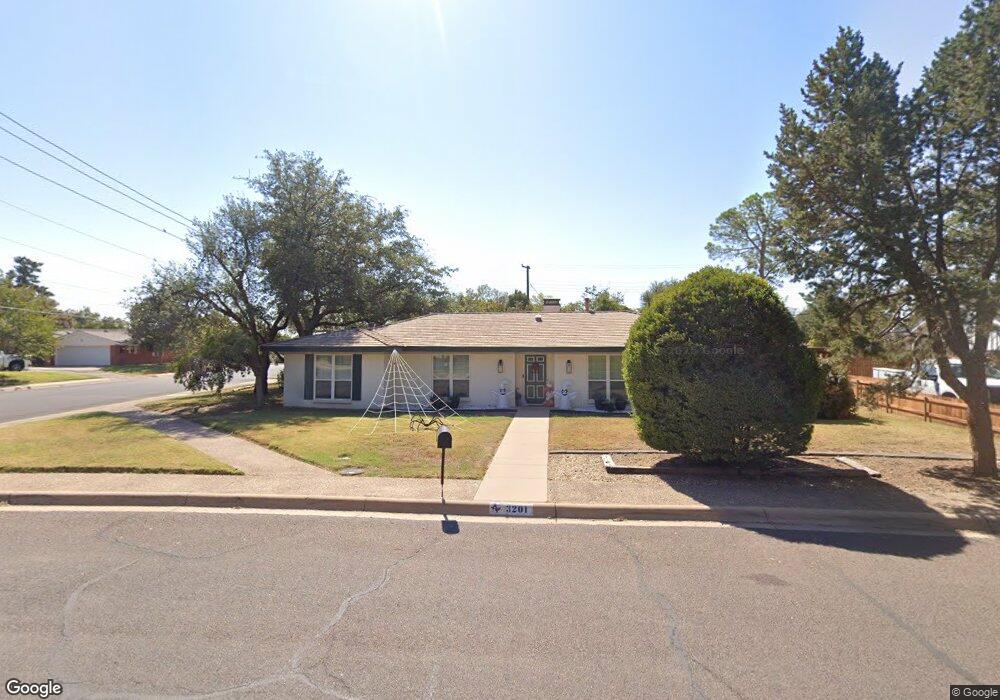
3201 Marmon Dr Midland, TX 79705
Estimated Value: $414,000 - $422,501
4
Beds
3
Baths
2,900
Sq Ft
$144/Sq Ft
Est. Value
About This Home
This home is located at 3201 Marmon Dr, Midland, TX 79705 and is currently estimated at $418,125, approximately $144 per square foot. 3201 Marmon Dr is a home located in Midland County with nearby schools including Midland High School, Robert H. Goddard Junior High School, and Trinity School of Midland.
Ownership History
Date
Name
Owned For
Owner Type
Purchase Details
Closed on
Jun 4, 2025
Sold by
Finn Sam and Finn Heather Pressley
Bought by
Jones Mason and Beer Caitlin
Current Estimated Value
Home Financials for this Owner
Home Financials are based on the most recent Mortgage that was taken out on this home.
Original Mortgage
$336,000
Outstanding Balance
$335,137
Interest Rate
6.81%
Mortgage Type
New Conventional
Estimated Equity
$82,988
Purchase Details
Closed on
Jan 13, 2022
Sold by
Lyn Fishman Elva
Bought by
Finn Sam and Finn Heather Pressley
Home Financials for this Owner
Home Financials are based on the most recent Mortgage that was taken out on this home.
Original Mortgage
$344,543
Interest Rate
3.22%
Mortgage Type
FHA
Purchase Details
Closed on
Jun 3, 2005
Sold by
Fishman Sheryl Ann
Bought by
Fishman Noah
Purchase Details
Closed on
Jun 13, 1979
Bought by
Fishman Noah
Create a Home Valuation Report for This Property
The Home Valuation Report is an in-depth analysis detailing your home's value as well as a comparison with similar homes in the area
Home Values in the Area
Average Home Value in this Area
Purchase History
| Date | Buyer | Sale Price | Title Company |
|---|---|---|---|
| Jones Mason | -- | Lone Star Abstract & Title | |
| Finn Sam | -- | Pinson Law Firm | |
| Fishman Noah | -- | None Available | |
| Fishman Noah | -- | -- |
Source: Public Records
Mortgage History
| Date | Status | Borrower | Loan Amount |
|---|---|---|---|
| Open | Jones Mason | $336,000 | |
| Previous Owner | Finn Sam | $344,543 |
Source: Public Records
Tax History Compared to Growth
Tax History
| Year | Tax Paid | Tax Assessment Tax Assessment Total Assessment is a certain percentage of the fair market value that is determined by local assessors to be the total taxable value of land and additions on the property. | Land | Improvement |
|---|---|---|---|---|
| 2025 | $5,590 | $390,730 | $31,500 | $359,230 |
| 2024 | $5,598 | $368,630 | $31,500 | $337,130 |
| 2023 | $5,134 | $342,570 | $31,500 | $311,070 |
| 2022 | $4,579 | $293,100 | $31,500 | $261,600 |
| 2021 | $4,955 | $284,430 | $31,500 | $252,930 |
| 2020 | $4,398 | $290,990 | $31,500 | $259,490 |
| 2019 | $5,503 | $290,690 | $31,500 | $259,490 |
| 2018 | $5,138 | $264,260 | $31,500 | $232,760 |
| 2017 | $4,806 | $247,170 | $31,500 | $215,670 |
| 2016 | $4,691 | $240,850 | $31,500 | $209,350 |
| 2015 | -- | $229,540 | $31,500 | $198,040 |
| 2014 | -- | $220,350 | $31,500 | $188,850 |
Source: Public Records
Map
Nearby Homes
- 3200 Durant Dr
- 3207 Marmon Dr
- 3205 Maxwell Dr
- 3203 Maxwell Dr
- 3200 W Wadley Ave
- 3204 W Wadley Ave
- 2817 Maxwell Dr
- 2811 Durant Dr
- 3105 Auburn Dr
- 3 Marinor Ct
- 3200 Whitney Dr
- 4 Amhurst Ct
- 2806 Auburn Dr
- 5 Chatham Ct
- 3323 Maxwell Dr
- 2605 Inwood Ct
- 63 Ironwood Ct Unit 91
- 63 Ironwood Ct
- 2824 Cimmaron Ave
- 3322 Providence Dr
- 3203 Marmon Dr
- 3202 Durant Dr
- 2827 Marmon Dr
- 3200 Marmon Dr
- 3205 Marmon Dr
- 3204 Durant Dr
- 2828 Durant Dr
- 2826 Marmon Dr
- 3206 Durant Dr
- 2825 Marmon Dr
- 2826 Durant Dr
- 3201 Maxwell Dr
- 2824 Marmon Dr
- 3203 Durant Dr
- 3201 Durant Dr
- 3208 Durant Dr
- 3205 Durant Dr
- 2827 Maxwell Dr
- 3207 Durant Dr
- 2823 Marmon Dr