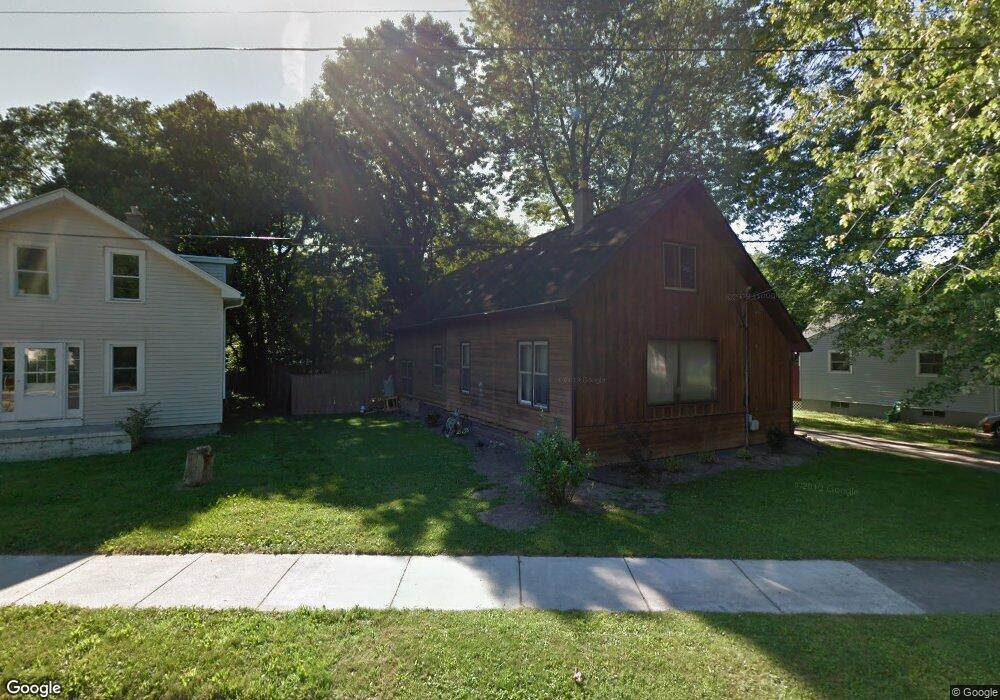
3201 Stabler St Lansing, MI 48910
Old Everett NeighborhoodEstimated Value: $149,000 - $170,000
--
Bed
--
Bath
1,628
Sq Ft
$98/Sq Ft
Est. Value
About This Home
This home is located at 3201 Stabler St, Lansing, MI 48910 and is currently estimated at $159,467, approximately $97 per square foot. 3201 Stabler St is a home located in Ingham County with nearby schools including Kendon School, Attwood School, and Everett High School.
Ownership History
Date
Name
Owned For
Owner Type
Purchase Details
Closed on
Mar 10, 2021
Sold by
Murphy James E and Murphy Donna J
Bought by
Janson Betsie Jean
Current Estimated Value
Purchase Details
Closed on
Mar 23, 2006
Sold by
Murphy James E and Murphy Donna J
Bought by
Murphy James E and Murphy Donna J
Purchase Details
Closed on
May 9, 2005
Sold by
Murphy James E and Murphy Donna J
Bought by
The James E Murphy Living Trust
Purchase Details
Closed on
Apr 28, 2005
Sold by
Dagenais Kim J and Dagenais Barbara
Bought by
Murphy James E and Murphy Donna J
Purchase Details
Closed on
Jun 7, 2002
Sold by
Wood George S and Wood Carolyn C
Bought by
Dagenais Kim J and Dagenais Barbara
Create a Home Valuation Report for This Property
The Home Valuation Report is an in-depth analysis detailing your home's value as well as a comparison with similar homes in the area
Home Values in the Area
Average Home Value in this Area
Purchase History
| Date | Buyer | Sale Price | Title Company |
|---|---|---|---|
| Janson Betsie Jean | -- | None Available | |
| Murphy James E | -- | None Available | |
| The James E Murphy Living Trust | -- | -- | |
| Murphy James E | $124,500 | -- | |
| Dagenais Kim J | $114,000 | -- |
Source: Public Records
Tax History Compared to Growth
Tax History
| Year | Tax Paid | Tax Assessment Tax Assessment Total Assessment is a certain percentage of the fair market value that is determined by local assessors to be the total taxable value of land and additions on the property. | Land | Improvement |
|---|---|---|---|---|
| 2025 | $3,562 | $75,500 | $7,100 | $68,400 |
| 2024 | $28 | $62,500 | $7,100 | $55,400 |
| 2023 | $3,339 | $56,200 | $7,100 | $49,100 |
| 2022 | $3,008 | $49,300 | $7,700 | $41,600 |
| 2021 | $2,184 | $44,700 | $4,200 | $40,500 |
| 2020 | $2,779 | $44,100 | $4,200 | $39,900 |
| 2019 | $2,686 | $42,000 | $4,200 | $37,800 |
| 2018 | $2,546 | $35,300 | $4,200 | $31,100 |
| 2017 | $2,451 | $35,300 | $4,200 | $31,100 |
| 2016 | $2,460 | $33,000 | $4,200 | $28,800 |
| 2015 | $2,460 | $31,900 | $8,345 | $23,555 |
| 2014 | $2,460 | $32,600 | $6,119 | $26,481 |
Source: Public Records
Map
Nearby Homes
- 100 Dunlap St
- 3319 Jewell Ave
- 413 E Hodge Ave
- 3145 S Cedar St
- 334 Dunlap St
- 3216 Ellen Ave
- 410 Dunlap St
- 416 W Holmes Rd
- 2901 Palmer St
- 3322 Palmer St
- 610 N Dexter Dr
- 3430 Palmer St
- 3801 Stabler St
- 2806 S Washington Ave
- 3805 Donald St
- 0 Rickle
- 2406 Markley Place
- 2230 Maplewood Ave
- 715 W Holmes Rd
- 4022 Stabler St