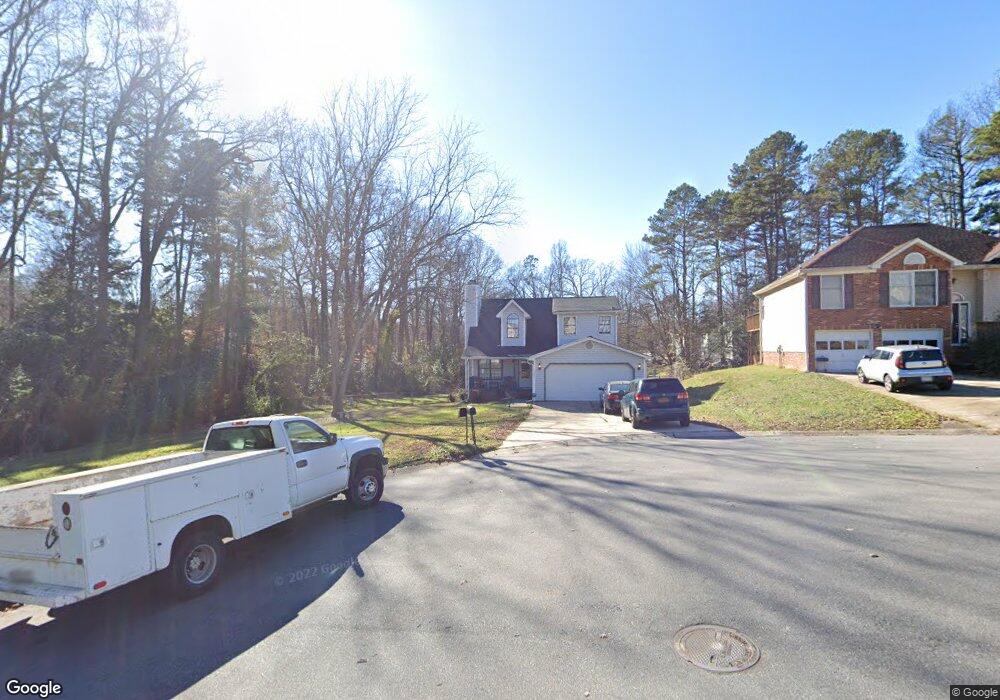
3201 Stephens Farm Ln Charlotte, NC 28269
Nevin Community NeighborhoodEstimated Value: $271,000 - $282,000
3
Beds
2
Baths
1,334
Sq Ft
$206/Sq Ft
Est. Value
About This Home
This home is located at 3201 Stephens Farm Ln, Charlotte, NC 28269 and is currently estimated at $274,895, approximately $206 per square foot. 3201 Stephens Farm Ln is a home located in Mecklenburg County with nearby schools including Winding Springs Elementary School, James Martin Middle, and North Mecklenburg High.
Ownership History
Date
Name
Owned For
Owner Type
Purchase Details
Closed on
Jul 28, 2011
Sold by
U S Bank National Association Nd
Bought by
Kommareddi Guna Sundari and Kommareddi S
Current Estimated Value
Purchase Details
Closed on
Mar 23, 2011
Sold by
Sherrill Melissa and Rankin Karon
Bought by
U S Bank N A Nd
Purchase Details
Closed on
May 9, 2000
Sold by
Arlington Cornelius and Arlington Kathy
Bought by
Rankin Karon and Sherrill Melissa
Home Financials for this Owner
Home Financials are based on the most recent Mortgage that was taken out on this home.
Original Mortgage
$98,000
Interest Rate
11.69%
Mortgage Type
Purchase Money Mortgage
Purchase Details
Closed on
Jul 21, 1999
Sold by
Latham Nola Harsey and Latham Frank
Bought by
Cornelius Arlington and Cornelius Kathy
Home Financials for this Owner
Home Financials are based on the most recent Mortgage that was taken out on this home.
Original Mortgage
$14,300
Interest Rate
7.51%
Mortgage Type
Seller Take Back
Create a Home Valuation Report for This Property
The Home Valuation Report is an in-depth analysis detailing your home's value as well as a comparison with similar homes in the area
Home Values in the Area
Average Home Value in this Area
Purchase History
| Date | Buyer | Sale Price | Title Company |
|---|---|---|---|
| Kommareddi Guna Sundari | $40,000 | None Available | |
| U S Bank N A Nd | $62,400 | None Available | |
| Rankin Karon | $98,000 | -- | |
| Cornelius Arlington | $20,000 | -- |
Source: Public Records
Mortgage History
| Date | Status | Borrower | Loan Amount |
|---|---|---|---|
| Previous Owner | Rankin Karon | $98,000 | |
| Previous Owner | Cornelius Arlington | $14,300 |
Source: Public Records
Tax History Compared to Growth
Tax History
| Year | Tax Paid | Tax Assessment Tax Assessment Total Assessment is a certain percentage of the fair market value that is determined by local assessors to be the total taxable value of land and additions on the property. | Land | Improvement |
|---|---|---|---|---|
| 2025 | $1,817 | $219,700 | $50,000 | $169,700 |
| 2024 | $1,817 | $219,700 | $50,000 | $169,700 |
| 2023 | $1,751 | $219,700 | $50,000 | $169,700 |
| 2022 | $1,577 | $150,400 | $30,000 | $120,400 |
| 2021 | $1,566 | $150,400 | $30,000 | $120,400 |
| 2020 | $1,559 | $150,400 | $30,000 | $120,400 |
| 2019 | $1,543 | $150,400 | $30,000 | $120,400 |
| 2018 | $1,340 | $96,500 | $15,000 | $81,500 |
| 2017 | $1,312 | $96,500 | $15,000 | $81,500 |
| 2016 | $1,303 | $96,500 | $15,000 | $81,500 |
| 2015 | $1,291 | $96,500 | $15,000 | $81,500 |
| 2014 | $1,301 | $96,500 | $15,000 | $81,500 |
Source: Public Records
Map
Nearby Homes
- 5201 Poplar Springs Dr
- 2924 Zion Renaissance Ln Unit 81
- 2826 Hosta Dr
- 3813 Old Wagon Rd
- 5557 Seths Dr Unit 905
- 5515 Greene St
- 3129 Nevin Place Dr Unit 1306
- 5501 Anderson Rd
- 3354 W Sugar Creek Rd
- 5900 Peach St
- 5909 Maple St
- 5901 Howard St
- 2824 Fairstone Ave
- 6327 Mallard View Ln Unit 4
- 5615 Torrence St
- 5924 Torrence St Unit 22
- 5618 Douglas St Unit 16
- 4301 Perkins Rd
- 6359 Mallard View Ln Unit 6
- 4012 Brandie Glen Rd
- 3209 Stephens Farm Ln
- 5306 Granite Creek Ln
- 5306 Granite Creek Ln
- 5306 Granite Creek Ln Unit 26
- 3200 Stephens Farm Ln
- 5300 Granite Creek Ln
- 5301 Hoover Dr
- 5311 Hoover Dr
- 3208 Stephens Farm Ln
- 5230 Granite Creek Ln
- 3214 Stephens Farm Ln
- 5321 Granite Creek Ln
- 5315 Granite Creek Ln
- 5235 Hoover Dr
- 3302 Green Meadow Dr
- 3300 Stephens Farm Ln
- 5224 Granite Creek Ln
- 2132 Ryker Davis Ln
- 2136 Ryker Davis Ln
- 2128 Ryker Davis Ln