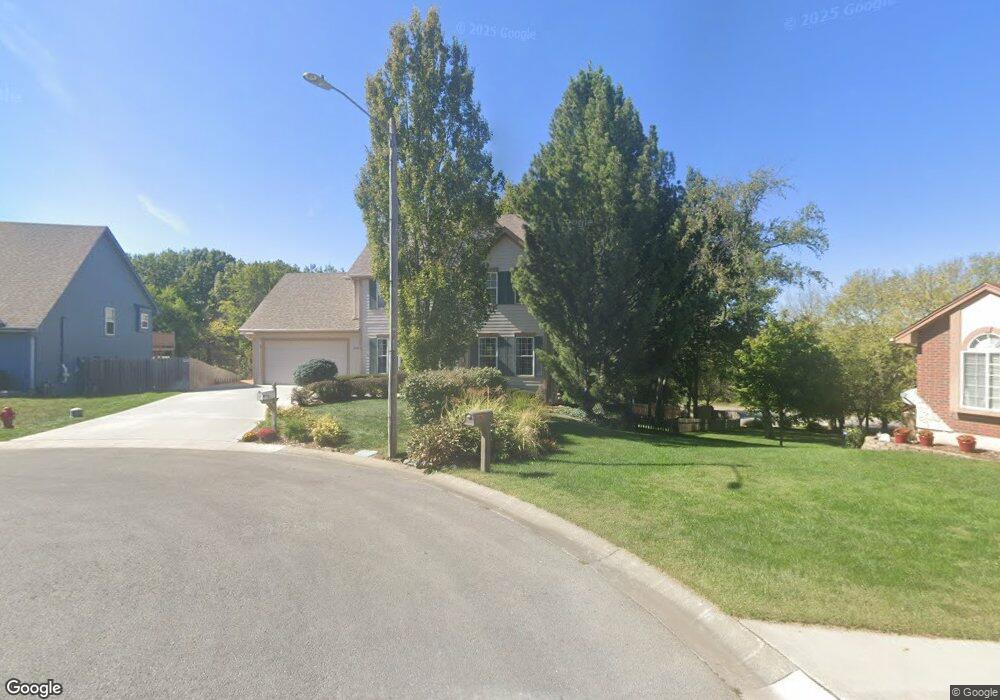
3201 SW 11th Street Cir Blue Springs, MO 64015
Estimated Value: $385,000 - $445,934
5
Beds
4
Baths
1,950
Sq Ft
$215/Sq Ft
Est. Value
About This Home
This home is located at 3201 SW 11th Street Cir, Blue Springs, MO 64015 and is currently estimated at $419,984, approximately $215 per square foot. 3201 SW 11th Street Cir is a home located in Jackson County with nearby schools including Cordill-Mason Elementary School, Moreland Ridge Middle School, and Blue Springs South High School.
Ownership History
Date
Name
Owned For
Owner Type
Purchase Details
Closed on
Apr 12, 2000
Sold by
Stamps Danny P and Stamps Margaret J
Bought by
Stamps Danny P and Stamps Margaret R
Current Estimated Value
Home Financials for this Owner
Home Financials are based on the most recent Mortgage that was taken out on this home.
Original Mortgage
$57,000
Outstanding Balance
$19,584
Interest Rate
8.27%
Mortgage Type
Stand Alone Second
Estimated Equity
$400,400
Purchase Details
Closed on
Aug 12, 1997
Sold by
Penn Bro Corporation
Bought by
Stamps Danny P and Stamps Margaret J
Home Financials for this Owner
Home Financials are based on the most recent Mortgage that was taken out on this home.
Original Mortgage
$131,900
Outstanding Balance
$19,875
Interest Rate
7.6%
Mortgage Type
Purchase Money Mortgage
Estimated Equity
$400,109
Purchase Details
Closed on
Dec 9, 1996
Sold by
Miller Enterprises Inc
Bought by
Penn Bro Corp
Create a Home Valuation Report for This Property
The Home Valuation Report is an in-depth analysis detailing your home's value as well as a comparison with similar homes in the area
Home Values in the Area
Average Home Value in this Area
Purchase History
| Date | Buyer | Sale Price | Title Company |
|---|---|---|---|
| Stamps Danny P | -- | Chicago Title Co | |
| Stamps Danny P | -- | Security Land Title Company | |
| Penn Bro Corp | -- | Security Land Title Company |
Source: Public Records
Mortgage History
| Date | Status | Borrower | Loan Amount |
|---|---|---|---|
| Open | Stamps Danny P | $57,000 | |
| Open | Stamps Danny P | $131,900 |
Source: Public Records
Tax History Compared to Growth
Tax History
| Year | Tax Paid | Tax Assessment Tax Assessment Total Assessment is a certain percentage of the fair market value that is determined by local assessors to be the total taxable value of land and additions on the property. | Land | Improvement |
|---|---|---|---|---|
| 2025 | $6,327 | $61,812 | $9,437 | $52,375 |
| 2024 | $6,205 | $77,552 | $9,511 | $68,041 |
| 2023 | $6,205 | $77,553 | $7,454 | $70,099 |
| 2022 | $4,232 | $46,740 | $6,821 | $39,919 |
| 2021 | $4,228 | $46,740 | $6,821 | $39,919 |
| 2020 | $3,773 | $42,425 | $6,821 | $35,604 |
| 2019 | $3,647 | $42,425 | $6,821 | $35,604 |
| 2018 | $3,584 | $40,127 | $5,086 | $35,041 |
| 2017 | $3,485 | $40,127 | $5,086 | $35,041 |
| 2016 | $3,485 | $39,121 | $7,486 | $31,635 |
| 2014 | $3,285 | $36,759 | $7,000 | $29,759 |
Source: Public Records
Map
Nearby Homes
- 3205 SW 8th St
- 2807 SW Summer Creek Ct
- 3608 SW 10th Street Ct
- 3605 SW Meyer Blvd
- 2603 SW Shadow Creek Ct
- 3908 SW 9th St
- 1103 SW Stonecreek Dr
- 3400 SW 22nd St
- 4000 SW 9th St
- 309 SW Moreland School Rd
- 2413 SW Emerald Creek Place
- 404 SW Shamrock Place
- 3101 S 1 St
- 2257 SW Wall St
- 2253 SW Wall St
- 104 SE Sherri Ln
- 2115 S 7 Hwy
- 1004 SW Hiawatha Dr
- 1804 SW Cherokee Strip
- 1205 SW Southgate Dr
- 3205 SW 11th Street Cir
- 3200 SW 11th Street Cir
- 3209 SW 11th Street Cir
- 3204 SW 11th Street Cir
- 3212 SW 11th Street Cir
- 3208 SW 11th Street Cir
- 3205 SW 10th Terrace
- 3216 SW 11th Street Cir
- 3217 SW 11th Street Cir
- 3209 SW 10th Terrace
- 3304 SW Meyer Blvd
- 3220 SW 11th Street Cir
- 3201 SW 10th Terrace
- 3308 SW Meyer Blvd
- 3213 SW 10th Terrace
- 3312 SW Meyer Blvd
- 3217 SW 10th Terrace
- 3316 SW Meyer Blvd
- 3200 SW 10th Terrace