3201 Westchester Rd Toledo, OH 43615
Estimated Value: $248,006 - $264,000
3
Beds
2
Baths
1,540
Sq Ft
$167/Sq Ft
Est. Value
About This Home
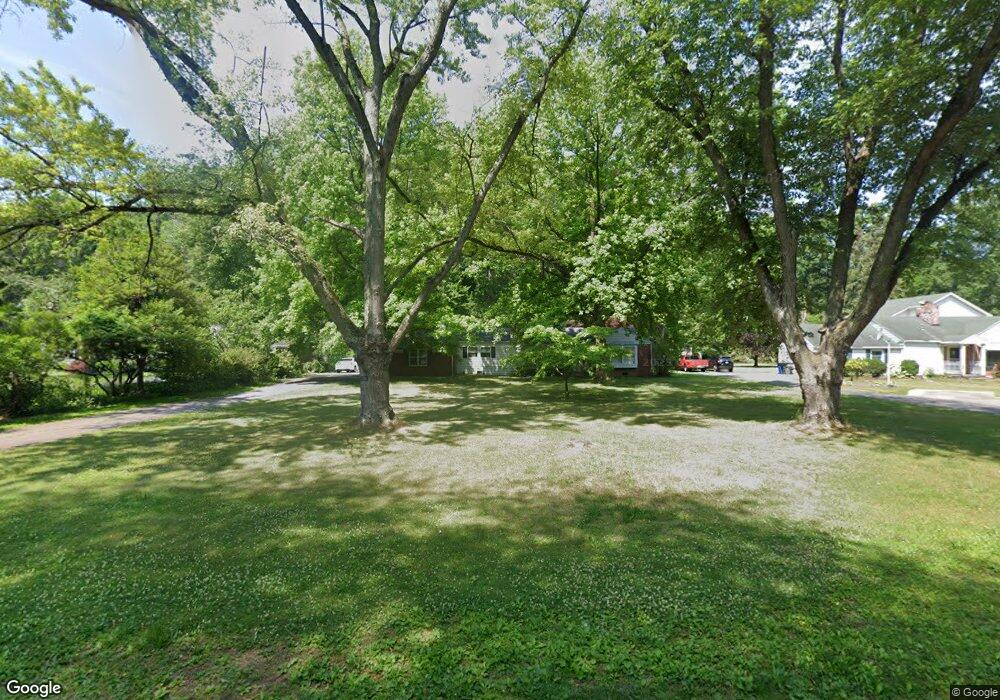
This home is located at 3201 Westchester Rd, Toledo, OH 43615 and is currently estimated at $257,752, approximately $167 per square foot. 3201 Westchester Rd is a home located in Lucas County with nearby schools including Whiteford Elementary School, Sylvania Arbor Hills Junior High School, and Sylvania Southview High School.
Ownership History
Date
Name
Owned For
Owner Type
Purchase Details
Closed on
Jan 23, 2025
Sold by
Afshar Mehry and Khamseh Khadijeh Arshadi
Bought by
Khadijeh Arshadi Khamseh Living Trust and Khamseh
Current Estimated Value
Purchase Details
Closed on
Mar 18, 2014
Sold by
Afshar Javad E and Afshar Javad
Bought by
Afshar Javad E and Afshar Mehry
Purchase Details
Closed on
Sep 20, 2000
Sold by
Platz Phillip E and Istine Mary Chr
Bought by
Afshar Javad
Home Financials for this Owner
Home Financials are based on the most recent Mortgage that was taken out on this home.
Original Mortgage
$123,300
Interest Rate
7.96%
Purchase Details
Closed on
Oct 10, 1995
Sold by
Denniss Sharon S
Bought by
Platz Phillip E and Platz Mary E
Home Financials for this Owner
Home Financials are based on the most recent Mortgage that was taken out on this home.
Original Mortgage
$96,300
Interest Rate
7.91%
Mortgage Type
New Conventional
Create a Home Valuation Report for This Property
The Home Valuation Report is an in-depth analysis detailing your home's value as well as a comparison with similar homes in the area
Home Values in the Area
Average Home Value in this Area
Purchase History
| Date | Buyer | Sale Price | Title Company |
|---|---|---|---|
| Khadijeh Arshadi Khamseh Living Trust | -- | None Listed On Document | |
| Afshar Javad E | -- | None Available | |
| Afshar Javad | $137,033 | Louisville Title Agency For | |
| Platz Phillip E | $107,000 | -- |
Source: Public Records
Mortgage History
| Date | Status | Borrower | Loan Amount |
|---|---|---|---|
| Previous Owner | Afshar Javad | $123,300 | |
| Previous Owner | Platz Phillip E | $96,300 |
Source: Public Records
Tax History Compared to Growth
Tax History
| Year | Tax Paid | Tax Assessment Tax Assessment Total Assessment is a certain percentage of the fair market value that is determined by local assessors to be the total taxable value of land and additions on the property. | Land | Improvement |
|---|---|---|---|---|
| 2024 | $4,246 | $66,150 | $13,160 | $52,990 |
| 2023 | $3,985 | $49,560 | $12,810 | $36,750 |
| 2022 | $3,565 | $49,560 | $12,810 | $36,750 |
| 2021 | $3,676 | $49,560 | $12,810 | $36,750 |
| 2020 | $3,516 | $40,950 | $10,465 | $30,485 |
| 2019 | $3,421 | $40,950 | $10,465 | $30,485 |
| 2018 | $3,170 | $40,950 | $10,465 | $30,485 |
| 2017 | $3,020 | $33,355 | $12,040 | $21,315 |
| 2016 | $3,022 | $95,300 | $34,400 | $60,900 |
| 2015 | $2,915 | $95,300 | $34,400 | $60,900 |
| 2014 | $2,510 | $33,360 | $12,040 | $21,320 |
| 2013 | $2,510 | $33,360 | $12,040 | $21,320 |
Source: Public Records
Map
Nearby Homes
- 4567 Torquay Ave
- 3205 Talmadge Rd
- 3221 Talmadge Rd
- 4545 Indian Rd
- 3321 Shakespeare Ln
- 4239 W Central Ave
- 3520 Scarsborough Rd
- 4146 Northmoor Rd
- 3000 Valley View Dr
- 4225 Talwood Ln
- 4132 Sheraton Rd
- 3733 Barcelona Dr
- 4634 Springbrook Dr
- 3844 W Central Ave
- 3205 Orchard Trail Dr
- 2720 Derby Rd
- 4225 Graceway Dr
- 4028 Brookside Rd
- 2949 Secretariat Rd
- 4754 Imperial Dr
- 3141 Westchester Rd
- 3215 Westchester Rd
- 3225 Westchester Rd
- 3131 Westchester Rd
- 3220 Cedarbrook Ct
- 3230 Cedarbrook Ct
- 3202 Westchester Rd
- 3214 Westchester Rd
- 3142 Westchester Rd
- 3117 Westchester Rd
- 4516 W Central Ave
- 4506 W Central Ave
- 3226 Westchester Rd
- 3132 Westchester Rd
- 3305 Westchester Rd
- 3219 Cedarbrook Ct
- 3310 Cedarbrook Dr
- 4526 W Central Ave
- 3229 Cedarbrook Ln
- 3229 Cedarbrook Ct