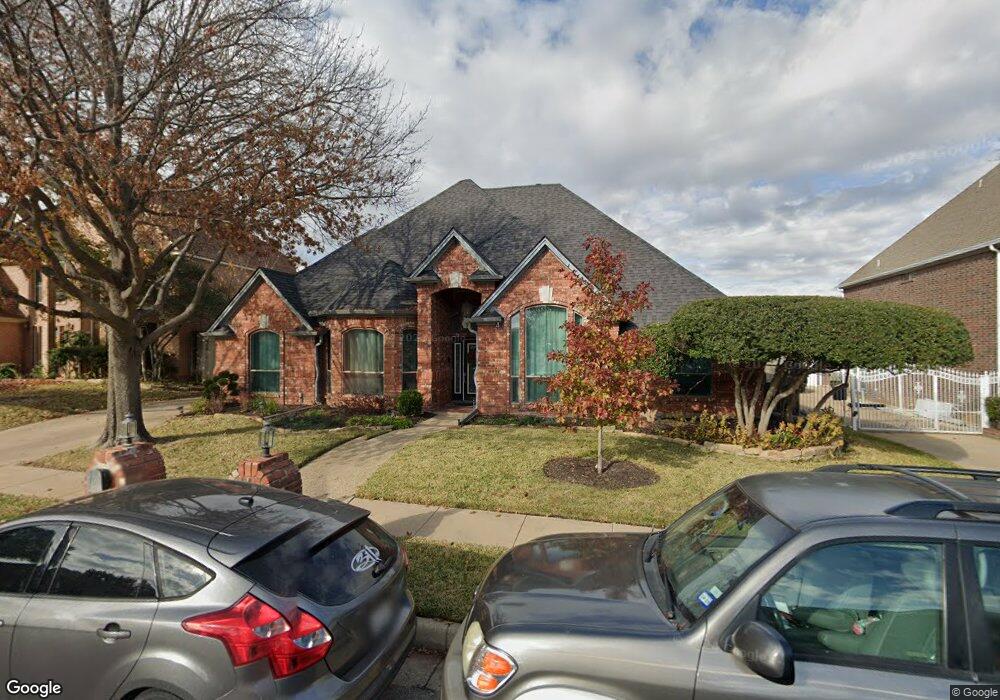
3201 Willow Creek Way Bedford, TX 76021
Estimated Value: $490,000 - $540,000
3
Beds
3
Baths
2,365
Sq Ft
$215/Sq Ft
Est. Value
About This Home
This home is located at 3201 Willow Creek Way, Bedford, TX 76021 and is currently estimated at $509,173, approximately $215 per square foot. 3201 Willow Creek Way is a home located in Tarrant County with nearby schools including Meadow Creek Elementary School, Harwood Junior High School, and Trinity High School.
Ownership History
Date
Name
Owned For
Owner Type
Purchase Details
Closed on
May 21, 2015
Sold by
Riley James
Bought by
White Mark A and White Juana I
Current Estimated Value
Home Financials for this Owner
Home Financials are based on the most recent Mortgage that was taken out on this home.
Original Mortgage
$228,288
Outstanding Balance
$175,481
Interest Rate
3.62%
Mortgage Type
FHA
Estimated Equity
$333,692
Purchase Details
Closed on
Jun 20, 2012
Sold by
Wooden William H
Bought by
Riley James
Purchase Details
Closed on
Mar 26, 1999
Sold by
Munk Rhonda J
Bought by
Wooden William H and Wooden Susan K
Home Financials for this Owner
Home Financials are based on the most recent Mortgage that was taken out on this home.
Original Mortgage
$161,160
Interest Rate
6.69%
Mortgage Type
VA
Purchase Details
Closed on
Nov 12, 1998
Sold by
Munk Bradley F
Bought by
Munk Rhonda J
Create a Home Valuation Report for This Property
The Home Valuation Report is an in-depth analysis detailing your home's value as well as a comparison with similar homes in the area
Home Values in the Area
Average Home Value in this Area
Purchase History
| Date | Buyer | Sale Price | Title Company |
|---|---|---|---|
| White Mark A | -- | Alamo Title | |
| Riley James | -- | None Available | |
| Wooden William H | -- | Ticor Land Title Co | |
| Munk Rhonda J | -- | -- |
Source: Public Records
Mortgage History
| Date | Status | Borrower | Loan Amount |
|---|---|---|---|
| Open | White Mark A | $228,288 | |
| Previous Owner | Wooden William H | $161,160 |
Source: Public Records
Tax History Compared to Growth
Tax History
| Year | Tax Paid | Tax Assessment Tax Assessment Total Assessment is a certain percentage of the fair market value that is determined by local assessors to be the total taxable value of land and additions on the property. | Land | Improvement |
|---|---|---|---|---|
| 2025 | $6,842 | $503,172 | $90,000 | $413,172 |
| 2024 | $6,842 | $503,172 | $90,000 | $413,172 |
| 2023 | $7,322 | $480,624 | $60,000 | $420,624 |
| 2022 | $7,580 | $405,715 | $60,000 | $345,715 |
| 2021 | $7,432 | $337,877 | $60,000 | $277,877 |
| 2020 | $6,820 | $286,823 | $60,000 | $226,823 |
| 2019 | $6,968 | $286,823 | $60,000 | $226,823 |
| 2018 | $6,032 | $264,010 | $60,000 | $204,010 |
| 2017 | $6,387 | $264,010 | $26,000 | $238,010 |
| 2016 | $5,677 | $234,684 | $26,000 | $208,684 |
| 2015 | -- | $205,000 | $26,000 | $179,000 |
| 2014 | -- | $223,600 | $26,000 | $197,600 |
Source: Public Records
Map
Nearby Homes
- 4001 Fairmont Ct
- 3112 Hazlewood Ct
- 3409 Crescent Ct
- 3409 Langley Hill Ln
- 3932 Cedar Ridge Dr
- 3917 Autumn Ln
- 3013 Bent Tree Ln
- 3024 Pecan Cir
- 3516 Lejoie Ln
- 3405 Scenic Hills Dr
- 3428 Pembroke Place
- 3901 Campania Ct
- 4005 Campania Ct
- 3909 Allendale St
- 3001 Glenwood Ct
- 3017 Bluebonnet Ln
- 4208 Lombardy Ct
- 3713 Teal Ln
- 3209 Misty Ct
- 3213 Vintage Way
- 3205 Willow Creek Way
- 3117 Willow Creek Way
- 3209 Willow Creek Way
- 4000 Westmont Ct
- 3113 Willow Creek Way
- 3100 Hazlewood Ct
- 4004 Westmont Ct
- 3101 Hazlewood Ct
- 3109 Willow Creek Way
- 4001 Westmont Ct
- 4008 Westmont Ct
- 3324 Hazlewood Ct
- 4009 Fairmont Ct
- 3104 Hazlewood Ct
- 3105 Hazlewood Ct
- 3213 Willow Creek Way
- 3108 Willow Creek Way
- 4000 Fairmont Ct
- 4012 Westmont Ct
- 4013 Fairmont Ct