3202 Cason Rd Blackshear, GA 31516
Estimated Value: $326,500
Studio
2
Baths
1,943
Sq Ft
$168/Sq Ft
Est. Value
About This Home
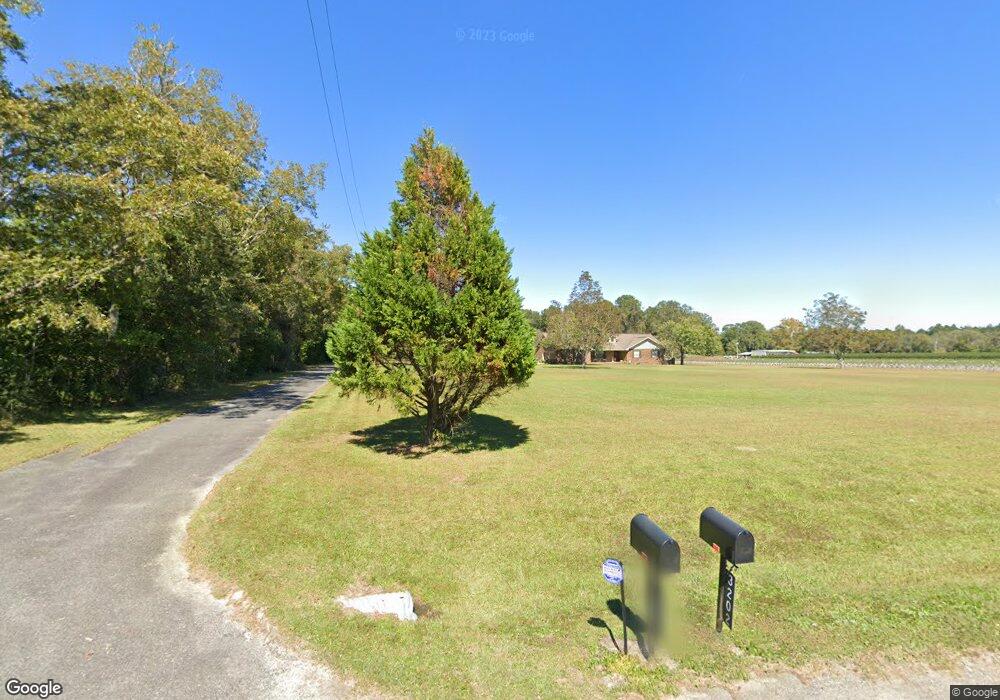
This home is located at 3202 Cason Rd, Blackshear, GA 31516 and is currently priced at $326,500, approximately $168 per square foot. 3202 Cason Rd is a home located in Pierce County with nearby schools including Pierce County High School, Southeast Christian Academy, and Truth Christian Academy.
Ownership History
Date
Name
Owned For
Owner Type
Purchase Details
Closed on
Apr 5, 2022
Sold by
Thomas Larry M
Bought by
Moon Benjamin and Moon Julie
Current Estimated Value
Purchase Details
Closed on
Oct 20, 2021
Sold by
Peacock Simon Lewis
Bought by
Thomas Larry M and Thomas Terri E
Purchase Details
Closed on
Aug 27, 1996
Sold by
Peacock Simon Lewis and Brooks Ann
Bought by
Peacock Simon Lewis and Brooks Ann
Purchase Details
Closed on
Jan 3, 1992
Sold by
Elizabeth Bennett J and Elizabeth Ann Tuten Ben
Bought by
Peacock Simon Lewis and Brooks Ann
Purchase Details
Closed on
Sep 6, 1978
Sold by
Tuten Omer W
Bought by
Elizabeth Bennett J and Elizabeth Ann Tut
Purchase Details
Closed on
Dec 12, 1925
Sold by
Tuten Allen E
Bought by
Tuten E L
Create a Home Valuation Report for This Property
The Home Valuation Report is an in-depth analysis detailing your home's value as well as a comparison with similar homes in the area
Home Values in the Area
Average Home Value in this Area
Purchase History
| Date | Buyer | Sale Price | Title Company |
|---|---|---|---|
| Moon Benjamin | $335,000 | -- | |
| Thomas Larry M | $300,000 | -- | |
| Peacock Simon Lewis | -- | -- | |
| Peacock Simon Lewis | $26,000 | -- | |
| Elizabeth Bennett J | -- | -- | |
| Tuten E L | -- | -- | |
| Tuten Piety M | -- | -- |
Source: Public Records
Tax History
| Year | Tax Paid | Tax Assessment Tax Assessment Total Assessment is a certain percentage of the fair market value that is determined by local assessors to be the total taxable value of land and additions on the property. | Land | Improvement |
|---|---|---|---|---|
| 2022 | $1,793 | $66,345 | $7,869 | $58,476 |
| 2020 | $2,086 | $76,934 | $22,472 | $54,462 |
| 2019 | $2,086 | $76,934 | $22,472 | $54,462 |
| 2018 | $1,988 | $73,519 | $21,402 | $52,117 |
| 2017 | $1,973 | $71,836 | $21,402 | $50,434 |
| 2016 | $1,672 | $71,836 | $21,402 | $50,434 |
| 2015 | $1,672 | $71,835 | $21,402 | $50,434 |
| 2014 | $1,672 | $71,835 | $21,402 | $50,434 |
| 2013 | $1,672 | $71,835 | $21,401 | $50,433 |
Source: Public Records
Map
Nearby Homes
- 3344 Strickland Ave
- 2936 Piney Grove Cir
- 3360 Strickland Avenue Extension
- 3551 Cason Rd
- 5605 Woodstone Dr
- 4055 Tamrose Ct
- 3026 Aragon Ct
- 00 Yeomans St
- 501 Watson St
- 106 Southern Oaks Ln
- 402 Mcgregor St
- 315 Strickland Ave
- 00 U S 84
- 241 Strickland Ave
- 6034 Turkey Oak Rd
- 3019 Aragon Ct
- 5571 Bowen Rd
- 5618 Bowen Rd
- 131 Fawn Ln
- 940 Gordon St
Your Personal Tour Guide
Ask me questions while you tour the home.