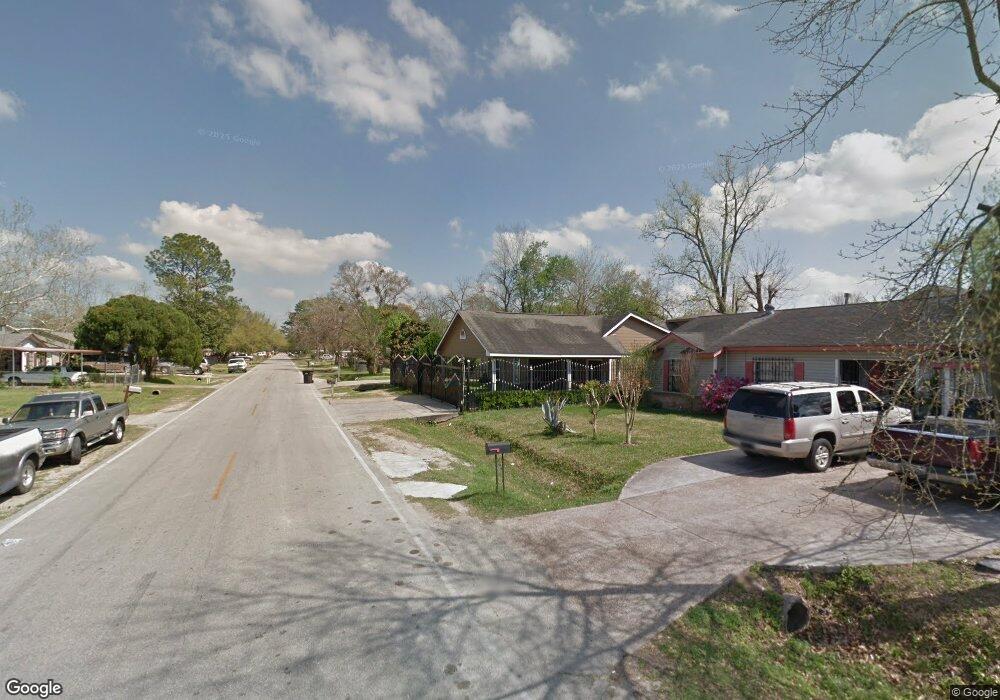
3202 Hurlingham St Houston, TX 77093
East Aldine NeighborhoodEstimated Value: $156,667 - $176,000
3
Beds
1
Bath
1,127
Sq Ft
$147/Sq Ft
Est. Value
About This Home
This home is located at 3202 Hurlingham St, Houston, TX 77093 and is currently estimated at $165,167, approximately $146 per square foot. 3202 Hurlingham St is a home located in Harris County with nearby schools including Vardeman EC/PK/K, Worsham Elementary School, and Macarthur Ninth Grade School.
Ownership History
Date
Name
Owned For
Owner Type
Purchase Details
Closed on
Dec 28, 2021
Sold by
Cesar Bernal Julio and Cesar Josefina
Bought by
Rojas Zaida Gomez
Current Estimated Value
Purchase Details
Closed on
Sep 24, 2021
Sold by
Bernal Julio Cesar and Porcayo-Dominguez Josefina
Bought by
Gomez Rojas Zaida
Home Financials for this Owner
Home Financials are based on the most recent Mortgage that was taken out on this home.
Original Mortgage
$70,000
Interest Rate
2.8%
Mortgage Type
Stand Alone Second
Purchase Details
Closed on
Sep 10, 2018
Sold by
Bernal Guadalupe and Bernal Teresa V
Bought by
Bernal Julio Cesar and Bernal Julio C
Purchase Details
Closed on
Mar 9, 2001
Sold by
Gutierrez Angelita U and Gutierrez Victor
Bought by
Bernal Guadalupe and Bernal Teresa
Home Financials for this Owner
Home Financials are based on the most recent Mortgage that was taken out on this home.
Original Mortgage
$38,800
Interest Rate
6.83%
Mortgage Type
Purchase Money Mortgage
Create a Home Valuation Report for This Property
The Home Valuation Report is an in-depth analysis detailing your home's value as well as a comparison with similar homes in the area
Home Values in the Area
Average Home Value in this Area
Purchase History
| Date | Buyer | Sale Price | Title Company |
|---|---|---|---|
| Rojas Zaida Gomez | -- | None Listed On Document | |
| Gomez Rojas Zaida | -- | None Listed On Document | |
| Rojas Zaida Gomez | -- | None Listed On Document | |
| Bernal Julio Cesar | -- | None Available | |
| Bernal Guadalupe | -- | General American Title |
Source: Public Records
Mortgage History
| Date | Status | Borrower | Loan Amount |
|---|---|---|---|
| Previous Owner | Rojas Zaida Gomez | $70,000 | |
| Previous Owner | Rojas Zaida Gomez | $70,000 | |
| Previous Owner | Bernal Guadalupe | $38,800 |
Source: Public Records
Tax History Compared to Growth
Tax History
| Year | Tax Paid | Tax Assessment Tax Assessment Total Assessment is a certain percentage of the fair market value that is determined by local assessors to be the total taxable value of land and additions on the property. | Land | Improvement |
|---|---|---|---|---|
| 2025 | $2,778 | $153,298 | $44,018 | $109,280 |
| 2024 | $2,778 | $143,584 | $44,018 | $99,566 |
| 2023 | $2,778 | $149,095 | $30,782 | $118,313 |
| 2022 | $2,500 | $121,561 | $30,782 | $90,779 |
| 2021 | $2,076 | $96,326 | $30,782 | $65,544 |
| 2020 | $2,117 | $93,198 | $30,782 | $62,416 |
| 2019 | $2,047 | $86,045 | $30,782 | $55,263 |
| 2018 | $994 | $69,220 | $14,775 | $54,445 |
| 2017 | $1,569 | $69,220 | $14,775 | $54,445 |
| 2016 | $1,569 | $69,220 | $14,775 | $54,445 |
| 2015 | $1,196 | $66,980 | $14,775 | $52,205 |
| 2014 | $1,196 | $53,619 | $14,775 | $38,844 |
Source: Public Records
Map
Nearby Homes
- 3214 Brea Crest St
- 2915 Brea Crest St
- 3111 Hartwick Rd
- 2930 Bertrand St
- 2922 Bertrand St
- 3418 Hopper Rd
- 2723 Castledale Dr
- 2817 Cromwell St
- 11716 Innsbury Dr
- 4007 Wedgewood St
- 4415 Mooney Rd
- 2629 Kowis St
- 2410 Mierianne St
- 11746 Somerset Ln
- 3804 Cedar Hill Ln
- 2311 Warwick Rd
- 2326 Sunny Dr
- 2636 Lone Oak Rd
- 2237 Cromwell St
- 2306 Wardmont St
- 3206 Hurlingham St
- 3122 Hurlingham St
- 3203 Brea Crest St
- 3118 Hurlingham St
- 3123 Brea Crest St
- 3207 Brea Crest St
- 3211 Brea Crest St
- 3119 Brea Crest St
- 3203 Hurlingham St
- 3214 Hurlingham St
- 3114 Hurlingham St
- 3123 Hurlingham St
- 3207 Hurlingham St
- 3119 Hurlingham St
- 3115 Brea Crest St
- 3215 Brea Crest St
- 3211 Hurlingham St
- 3218 Hurlingham St
- 3110 Hurlingham St
- 3215 Hurlingham St