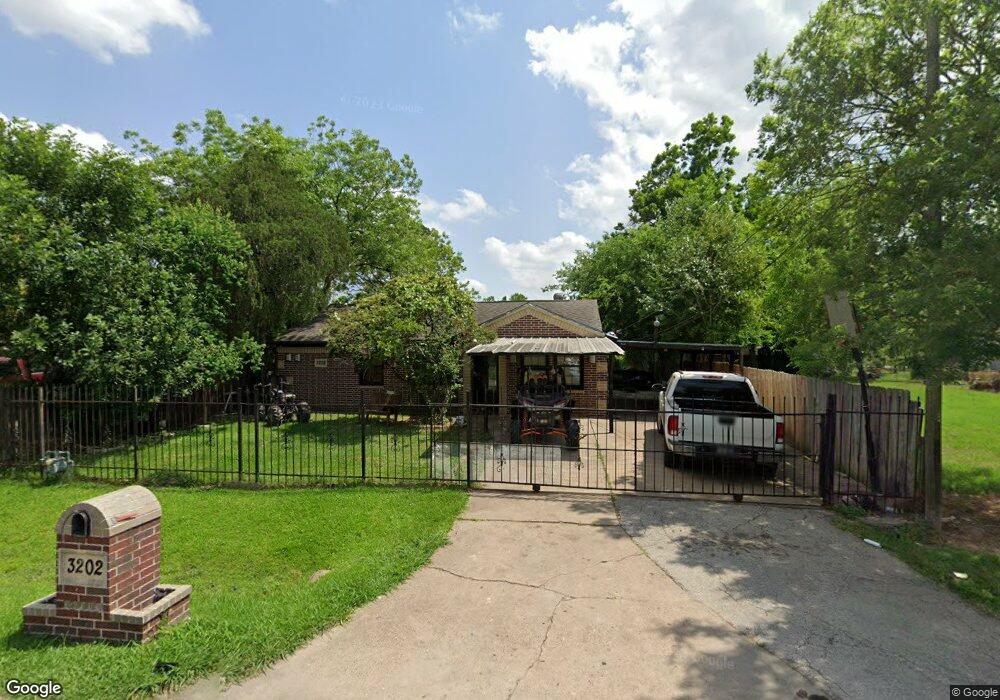
3202 Marzelle St Houston, TX 77093
Eastex-Jensen NeighborhoodEstimated Value: $165,174 - $203,000
3
Beds
1
Bath
1,204
Sq Ft
$153/Sq Ft
Est. Value
About This Home
This home is located at 3202 Marzelle St, Houston, TX 77093 and is currently estimated at $183,794, approximately $152 per square foot. 3202 Marzelle St is a home located in Harris County with nearby schools including Scarborough Elementary School, Patrick Henry Middle School, and Sam Houston Math, Science & Technology Center.
Ownership History
Date
Name
Owned For
Owner Type
Purchase Details
Closed on
Nov 4, 2021
Sold by
Ramirez Jacob
Bought by
Ramirez Fabiola
Current Estimated Value
Home Financials for this Owner
Home Financials are based on the most recent Mortgage that was taken out on this home.
Original Mortgage
$98,087
Outstanding Balance
$89,867
Interest Rate
2.98%
Mortgage Type
FHA
Estimated Equity
$93,927
Purchase Details
Closed on
Nov 22, 2017
Sold by
Ramirez Jacob and Ramirez Fabiola
Bought by
Calcon Mutual Mortgage and One Trust Home Loans
Home Financials for this Owner
Home Financials are based on the most recent Mortgage that was taken out on this home.
Original Mortgage
$95,243
Interest Rate
4.37%
Mortgage Type
FHA
Purchase Details
Closed on
Dec 19, 2016
Sold by
Batalha Llc
Bought by
Miah Investments A Corporation
Purchase Details
Closed on
Oct 14, 2016
Sold by
Reyes Lydia
Bought by
Batalha Llc
Create a Home Valuation Report for This Property
The Home Valuation Report is an in-depth analysis detailing your home's value as well as a comparison with similar homes in the area
Home Values in the Area
Average Home Value in this Area
Purchase History
| Date | Buyer | Sale Price | Title Company |
|---|---|---|---|
| Ramirez Fabiola | -- | Amrock Inc | |
| Calcon Mutual Mortgage | -- | First Western Title | |
| Miah Investments A Corporation | -- | None Available | |
| Batalha Llc | -- | None Available |
Source: Public Records
Mortgage History
| Date | Status | Borrower | Loan Amount |
|---|---|---|---|
| Open | Ramirez Fabiola | $98,087 | |
| Closed | Calcon Mutual Mortgage | $95,243 |
Source: Public Records
Tax History Compared to Growth
Tax History
| Year | Tax Paid | Tax Assessment Tax Assessment Total Assessment is a certain percentage of the fair market value that is determined by local assessors to be the total taxable value of land and additions on the property. | Land | Improvement |
|---|---|---|---|---|
| 2025 | $3,366 | $171,676 | $61,425 | $110,251 |
| 2024 | $3,366 | $160,876 | $50,625 | $110,251 |
| 2023 | $3,366 | $159,160 | $50,625 | $108,535 |
| 2022 | $2,998 | $136,153 | $33,750 | $102,403 |
| 2021 | $2,566 | $110,094 | $21,938 | $88,156 |
| 2020 | $2,530 | $104,464 | $21,938 | $82,526 |
| 2019 | $2,444 | $96,571 | $18,563 | $78,008 |
| 2018 | $1,487 | $58,761 | $18,563 | $40,198 |
| 2017 | $1,486 | $58,761 | $18,563 | $40,198 |
| 2016 | $1,395 | $55,187 | $18,563 | $36,624 |
| 2015 | -- | $55,187 | $18,563 | $36,624 |
| 2014 | -- | $66,973 | $18,563 | $48,410 |
Source: Public Records
Map
Nearby Homes
- 3202 Parker Rd
- 4918 Langley Rd
- 3709 Gager St
- 1904 Little York Rd
- 1728 Little York Rd
- 2633 Hollis St
- 2415 Goodloe St
- 2332 Margaret St
- 2318 Cresline St
- 2315 Langley Rd
- 2636 Lone Oak Rd
- 4509 Haywood St
- 3807 Hage St
- 3806 Hage St
- 0.0 Friendly Rd
- 2629 Kowis St
- 3302 Sparks St
- 3804 Cedar Hill Ln
- 4809 Edgewater Dr
- 2919 La Estancia Ln
- 3206 Marzelle St
- 3114 Marzelle St
- 3210 Marzelle St
- 3201 Lakewood Dr
- 3205 Lakewood Dr
- 3129 Lakewood Dr
- 3121 Lakewood Dr
- 3214 Marzelle St
- 3117 Lakewood Dr
- 3209 Lakewood Dr
- 3201 Marzelle St
- 3117 Marzelle St
- 3205 Marzelle St
- 3106 Marzelle St
- 3301 Lakewood Dr
- 3301 Lakewood Dr
- 3218 Marzelle St
- 3113 Marzelle St
- 3213 Marzelle St
- 3109 Marzelle St