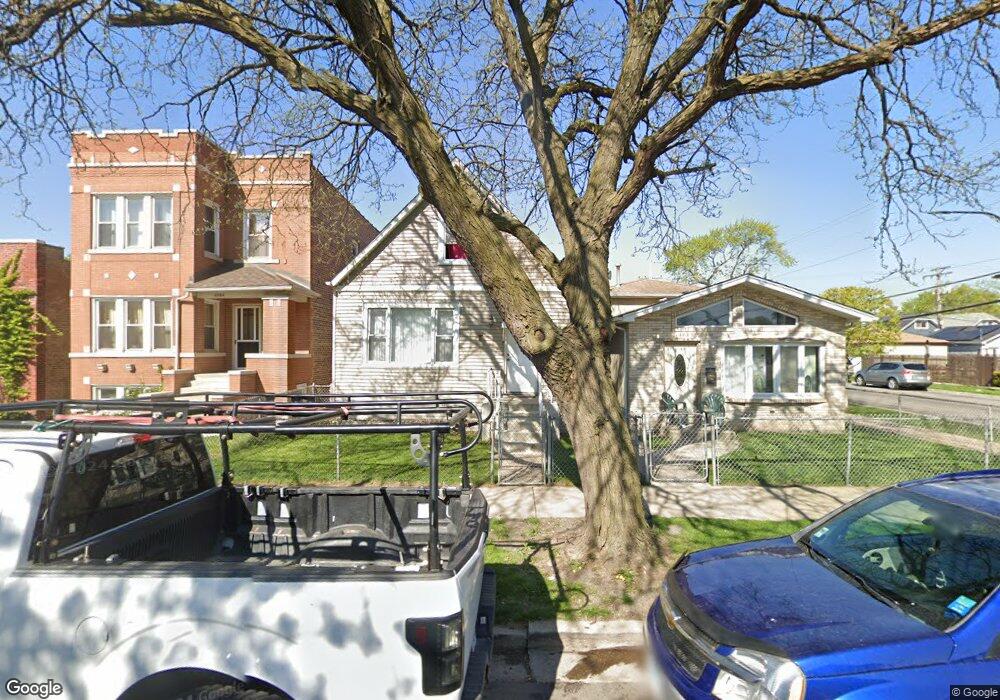
3202 S 54th Ave Cicero, IL 60804
Estimated Value: $223,000 - $315,000
3
Beds
1
Bath
1,110
Sq Ft
$245/Sq Ft
Est. Value
About This Home
This home is located at 3202 S 54th Ave, Cicero, IL 60804 and is currently estimated at $271,956, approximately $245 per square foot. 3202 S 54th Ave is a home located in Cook County with nearby schools including Columbus West Elementary School, Columbus East Elementary School, and Unity Jr High School.
Ownership History
Date
Name
Owned For
Owner Type
Purchase Details
Closed on
Aug 13, 2004
Sold by
Soto Moraima
Bought by
Zuniga Leopoldo and Zuniga Natalia
Current Estimated Value
Home Financials for this Owner
Home Financials are based on the most recent Mortgage that was taken out on this home.
Original Mortgage
$179,900
Interest Rate
7.5%
Mortgage Type
Unknown
Purchase Details
Closed on
Nov 17, 2003
Sold by
Fannie Mae
Bought by
Soto Moraima
Home Financials for this Owner
Home Financials are based on the most recent Mortgage that was taken out on this home.
Original Mortgage
$67,200
Interest Rate
8.87%
Mortgage Type
Purchase Money Mortgage
Purchase Details
Closed on
Jun 24, 2003
Sold by
Niedbala Krzysztof
Bought by
Federal National Mortgage Association
Purchase Details
Closed on
Apr 26, 2002
Sold by
Lasalle Bank National Assn
Bought by
Niedbala Krzysztof
Home Financials for this Owner
Home Financials are based on the most recent Mortgage that was taken out on this home.
Original Mortgage
$139,680
Interest Rate
7.16%
Create a Home Valuation Report for This Property
The Home Valuation Report is an in-depth analysis detailing your home's value as well as a comparison with similar homes in the area
Home Values in the Area
Average Home Value in this Area
Purchase History
| Date | Buyer | Sale Price | Title Company |
|---|---|---|---|
| Zuniga Leopoldo | $180,000 | Multiple | |
| Soto Moraima | -- | -- | |
| Federal National Mortgage Association | -- | -- | |
| Niedbala Krzysztof | $144,000 | -- |
Source: Public Records
Mortgage History
| Date | Status | Borrower | Loan Amount |
|---|---|---|---|
| Previous Owner | Zuniga Leopoldo | $179,900 | |
| Previous Owner | Soto Moraima | $67,200 | |
| Previous Owner | Niedbala Krzysztof | $139,680 |
Source: Public Records
Tax History Compared to Growth
Tax History
| Year | Tax Paid | Tax Assessment Tax Assessment Total Assessment is a certain percentage of the fair market value that is determined by local assessors to be the total taxable value of land and additions on the property. | Land | Improvement |
|---|---|---|---|---|
| 2024 | $4,968 | $18,000 | $3,642 | $14,358 |
| 2023 | $3,282 | $18,000 | $3,642 | $14,358 |
| 2022 | $3,282 | $10,938 | $3,134 | $7,804 |
| 2021 | $3,283 | $10,936 | $3,133 | $7,803 |
| 2020 | $3,288 | $10,936 | $3,133 | $7,803 |
| 2019 | $2,598 | $8,676 | $2,879 | $5,797 |
| 2018 | $2,527 | $8,676 | $2,879 | $5,797 |
| 2017 | $2,463 | $8,676 | $2,879 | $5,797 |
| 2016 | $3,143 | $8,957 | $2,371 | $6,586 |
| 2015 | $3,045 | $8,957 | $2,371 | $6,586 |
| 2014 | $2,957 | $8,957 | $2,371 | $6,586 |
| 2013 | $3,217 | $10,326 | $2,371 | $7,955 |
Source: Public Records
Map
Nearby Homes
- 3215 S 54th Ct
- 3141 S 54th Ct
- 3131 S 54th Ave
- 3628 54th Ct
- 3117 S 53rd Ave
- 3119 S 53rd Ave
- 5126 W 32nd St
- 5241 W 30th St
- 5129 W 31st Place
- 3117 S Laramie Ave Unit 3N
- 3419 S 54th Ave
- 2214 S Central Ave
- 5123 W 31st St
- 5108 W 32nd St
- 5101 W 32nd Place
- 5057 W 32nd Place
- 5011 W Ogden Ave
- 3529 S 54th Ave
- 3235 S 50th Ct
- 5028 W 31st Place
- 3200 S 54th Ave
- 3208 S 54th Ave
- 3212 S 54th Ave
- 3146 S 54th Ave
- 3216 S 54th Ave
- 3144 S 54th Ave Unit 1
- 3203 S 54th Ct
- 3205 S 54th Ct
- 3201 S 54th Ct
- 3207 S 54th Ct
- 3140 S 54th Ave
- 3220 S 54th Ave
- 3213 S 54th Ct
- 3145 S 54th Ct
- 3205 S 54th Ave
- 3138 S 54th Ave
- 3143 S 54th Ct
- 3136 S 54th Ave
- 3219 S 54th Ct
- 3226 S 54th Ave