3202 Swallow Ln Rolling Meadows, IL 60008
Estimated Value: $334,549 - $379,000
About This Home
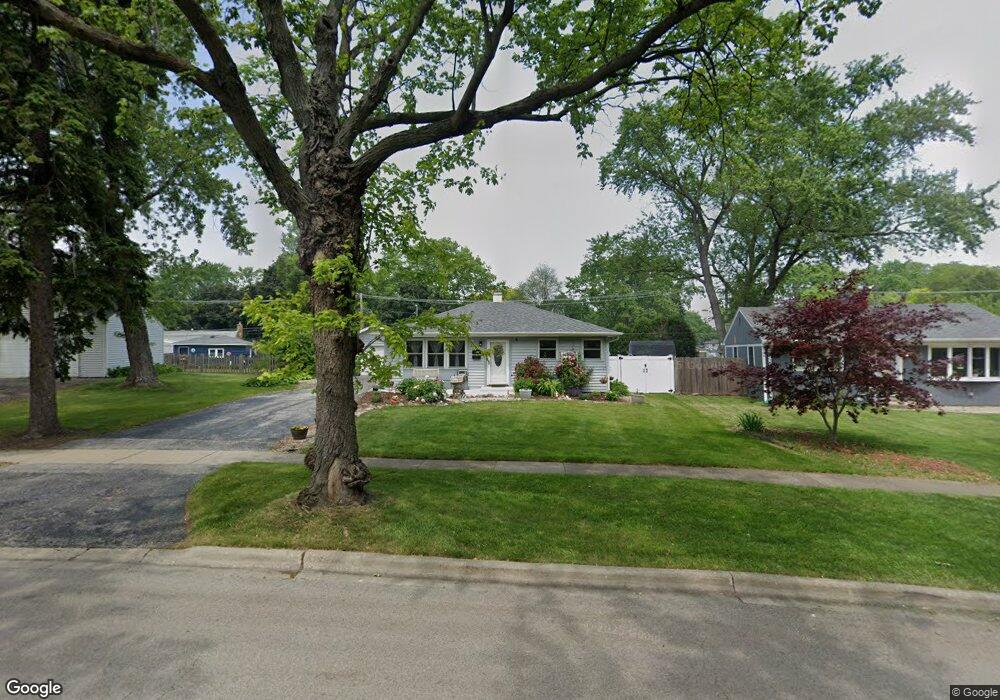
This home is located at 3202 Swallow Ln, Rolling Meadows, IL 60008 and is currently estimated at $350,637, approximately $315 per square foot. 3202 Swallow Ln is a home located in Cook County with nearby schools including Kimball Hill Elementary School, Carl Sandburg Junior High School, and Rolling Meadows High School.
Ownership History
We collect this data history from publicly available records. To have your information removed, we recommend requesting removal directly through your county’s website.
Purchase Details
Purchase Details
Purchase Details
Home Financials for this Owner
Home Financials are based on the most recent Mortgage that was taken out on this home.Purchase Details
Home Values in the Area
Average Home Value in this Area
Purchase History
We collect this data history from publicly available records. To have your information removed, we recommend requesting removal directly through your county’s website.
| Date | Buyer | Sale Price | Title Company |
|---|---|---|---|
| -- | None Listed On Document | ||
| -- | -- | ||
| -- | None Available | ||
| -- | -- |
Mortgage History
We collect this data history from publicly available records. To have your information removed, we recommend requesting removal directly through your county’s website.
| Date | Status | Borrower | Loan Amount |
|---|---|---|---|
| Previous Owner | $160,000 |
Tax History
We collect this data history from publicly available records. To have your information removed, we recommend requesting removal directly through your county’s website.
| Year | Tax Paid | Tax Assessment Tax Assessment Total Assessment is a certain percentage of the fair market value that is determined by local assessors to be the total taxable value of land and additions on the property. | Land | Improvement |
|---|---|---|---|---|
| 2025 | $6,339 | $27,000 | $5,645 | $21,355 |
| 2024 | $6,339 | $22,519 | $4,776 | $17,743 |
| 2023 | $6,040 | $24,000 | $4,776 | $19,224 |
| 2022 | $6,040 | $24,000 | $4,776 | $19,224 |
| 2021 | $4,442 | $16,743 | $2,822 | $13,921 |
| 2020 | $4,900 | $18,256 | $2,822 | $15,434 |
| 2019 | $4,937 | $20,398 | $2,822 | $17,576 |
| 2018 | $4,373 | $16,937 | $2,605 | $14,332 |
| 2017 | $4,303 | $16,937 | $2,605 | $14,332 |
| 2016 | $4,590 | $18,026 | $2,605 | $15,421 |
| 2015 | $3,560 | $13,931 | $2,388 | $11,543 |
| 2014 | $3,492 | $13,931 | $2,388 | $11,543 |
| 2013 | $3,390 | $13,931 | $2,388 | $11,543 |
Map
- 3135 Town Square Dr Unit 104
- 409 Lexington Ln
- 305 Lexington Ln
- 3204 Owl Dr
- 3000 Starling Ln
- 3265 Kirchoff Rd Unit 127
- 3265 Kirchoff Rd Unit 116
- 2539 Geranium Way
- 2718 Lily Ln
- 2807 Starling Ln
- 3609 Kingfisher Ln
- 3107 Falcon Ct W
- 2814 Cardinal Dr
- 3206 Wren Ln
- 3946 Balmoral Ct Unit 6
- 2503 George St
- 3712 Wren Ln
- 2204 Hawk Ln
- 2207 Kirchoff Rd
- 2 Dogwood Rd
- 3200 Swallow Ln
- 3204 Swallow Ln
- 3306 Pheasant Dr
- 3108 Swallow Ln
- 3109 Hawk Ln
- 3201 Hawk Ln
- 3304 Pheasant Dr
- 3107 Hawk Ln
- 3203 Hawk Ln
- 3106 Swallow Ln
- 3205 Swallow Ln
- 3203 Swallow Ln
- 3105 Hawk Ln
- 3205 Hawk Ln
- 3201 Swallow Ln
- 3104 Swallow Ln
- 3103 Hawk Ln
- 3404 Pheasant Dr
- 3109 Swallow Ln
- 3311 Pheasant Dr
Ask me questions while you tour the home.