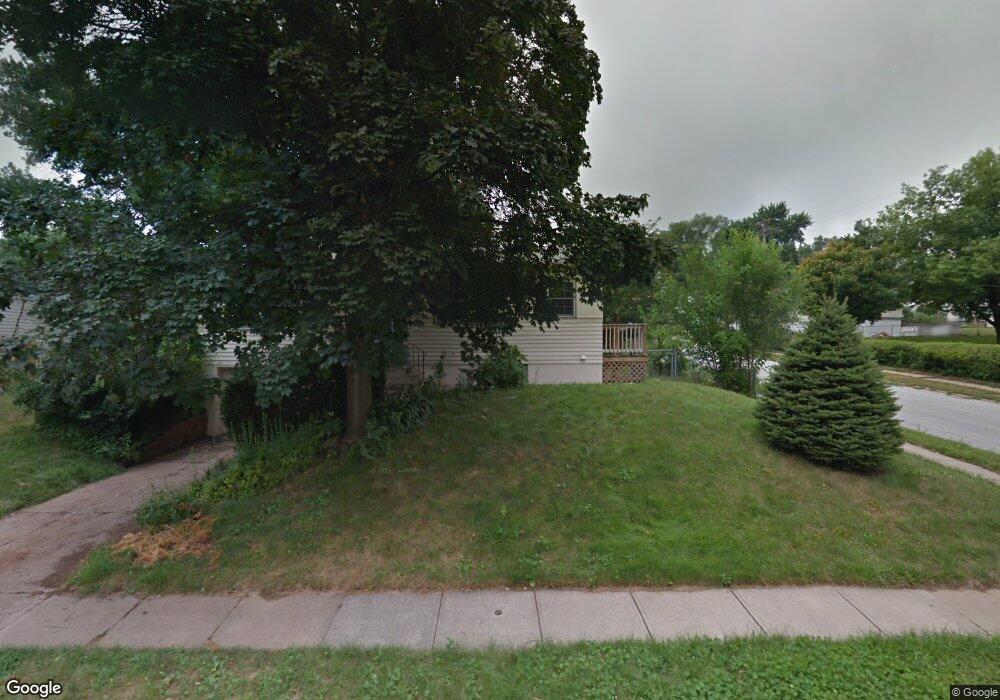
3202 Wallace Ave Bellevue, NE 68005
Estimated Value: $176,000 - $211,000
3
Beds
1
Bath
1,000
Sq Ft
$198/Sq Ft
Est. Value
About This Home
This home is located at 3202 Wallace Ave, Bellevue, NE 68005 and is currently estimated at $198,447, approximately $198 per square foot. 3202 Wallace Ave is a home located in Sarpy County with nearby schools including Betz Elementary School, Bellevue Mission Middle School, and Bellevue East High School.
Ownership History
Date
Name
Owned For
Owner Type
Purchase Details
Closed on
Sep 17, 2025
Sold by
Jennings Coleman O and Jennings Angela A
Bought by
Selfmade Llc
Current Estimated Value
Home Financials for this Owner
Home Financials are based on the most recent Mortgage that was taken out on this home.
Original Mortgage
$195,000
Outstanding Balance
$195,000
Interest Rate
6.63%
Mortgage Type
Construction
Estimated Equity
$3,447
Purchase Details
Closed on
Aug 5, 2009
Sold by
Perrin Michael G and Perrin Stephanie L
Bought by
Jennings Coleman O and Jennings Angela A
Home Financials for this Owner
Home Financials are based on the most recent Mortgage that was taken out on this home.
Original Mortgage
$114,400
Interest Rate
5.31%
Purchase Details
Closed on
Jan 11, 2008
Sold by
Harrelson Cleo Z
Bought by
Perrin Michael G and Perrin Stephanie L
Create a Home Valuation Report for This Property
The Home Valuation Report is an in-depth analysis detailing your home's value as well as a comparison with similar homes in the area
Home Values in the Area
Average Home Value in this Area
Purchase History
| Date | Buyer | Sale Price | Title Company |
|---|---|---|---|
| Selfmade Llc | $155,000 | Spyglass Title & Escrow | |
| Jennings Coleman O | $116,000 | Clean Title & Escrow Llc | |
| Perrin Michael G | $45,000 | Sts |
Source: Public Records
Mortgage History
| Date | Status | Borrower | Loan Amount |
|---|---|---|---|
| Open | Selfmade Llc | $195,000 | |
| Previous Owner | Jennings Coleman O | $114,400 |
Source: Public Records
Tax History Compared to Growth
Tax History
| Year | Tax Paid | Tax Assessment Tax Assessment Total Assessment is a certain percentage of the fair market value that is determined by local assessors to be the total taxable value of land and additions on the property. | Land | Improvement |
|---|---|---|---|---|
| 2025 | $2,591 | $159,407 | $30,000 | $129,407 |
| 2024 | $2,852 | $148,354 | $25,000 | $123,354 |
| 2023 | $2,852 | $135,076 | $25,000 | $110,076 |
| 2022 | $2,609 | $121,248 | $20,000 | $101,248 |
| 2021 | $2,241 | $103,005 | $18,000 | $85,005 |
| 2020 | $2,093 | $95,910 | $18,000 | $77,910 |
| 2019 | $2,032 | $93,700 | $18,000 | $75,700 |
| 2018 | $1,943 | $91,995 | $18,000 | $73,995 |
| 2017 | $1,839 | $86,480 | $18,000 | $68,480 |
| 2016 | $1,689 | $81,170 | $18,000 | $63,170 |
| 2015 | $1,639 | $79,240 | $18,000 | $61,240 |
| 2014 | $1,699 | $81,600 | $18,000 | $63,600 |
| 2012 | -- | $91,475 | $18,000 | $73,475 |
Source: Public Records
Map
Nearby Homes
- 409 W 30th Ave
- 3101 Washington St Unit 15
- 3101 Washington St Unit 53
- 2807 Calhoun St
- 2905 Wayne St
- 2604 Jackson St
- 2602 Crawford St
- 102 W 28th Ave
- 101 E 28th Ave
- 2709 Franklin St
- 2512 Washington St
- 2503 Wayne St
- 306 Paradise Terrace
- 306 37th Place
- 3543 Warren Place
- 2510 Hancock St
- 2519 Hancock St
- 2507 Hancock St
- 2504 Main St
- 706 W Mission Ave
- 3204 Wallace Ave
- 701 W 32nd Ave
- 3106 Wallace Ave
- 3206 Wallace Ave
- 702 W 33rd Ave
- 703 W 32nd Ave
- 3203 Wallace Ave
- 702 W 32nd Ave
- 3201 Wallace Ave
- 3205 Wallace Ave
- 3104 Wallace Ave
- 704 W 33rd Ave
- 3105 Wallace Ave
- 704 W 32nd Ave
- 705 W 32nd Ave
- 3207 Wallace Ave
- 3103 Wallace Ave
- 706 W 33rd Ave
- 701 W 31st Ave
- 3102 Wallace Ave