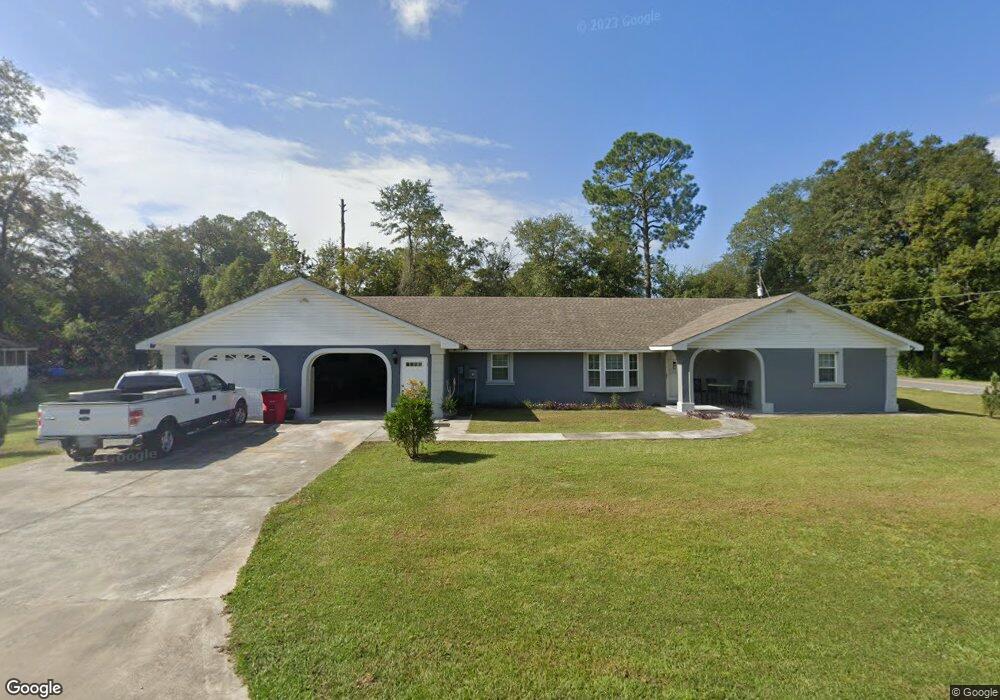
3203 Oates St Patterson, GA 31557
Estimated Value: $244,000 - $306,933
3
Beds
2
Baths
2,110
Sq Ft
$131/Sq Ft
Est. Value
About This Home
This home is located at 3203 Oates St, Patterson, GA 31557 and is currently estimated at $276,733, approximately $131 per square foot. 3203 Oates St is a home located in Pierce County with nearby schools including Pierce County High School and Southeast Christian Academy.
Ownership History
Date
Name
Owned For
Owner Type
Purchase Details
Closed on
Mar 27, 2025
Sold by
Jernigan Charles
Bought by
Jernigan Charles Jr Tr and Jernigan Sheldon Tr
Current Estimated Value
Home Financials for this Owner
Home Financials are based on the most recent Mortgage that was taken out on this home.
Original Mortgage
$54,000
Outstanding Balance
$51,421
Interest Rate
6.76%
Mortgage Type
New Conventional
Estimated Equity
$225,312
Purchase Details
Closed on
Jun 28, 2001
Sold by
Bank One National Association
Bought by
Jernigan Charles B
Purchase Details
Closed on
Sep 27, 2000
Sold by
Metropolitan Mortgage Co
Bought by
Bank One National Association
Purchase Details
Closed on
Nov 2, 1999
Sold by
Roberts Gloria
Bought by
Metropolitan Mortgage Company
Purchase Details
Closed on
Mar 20, 1998
Sold by
Jenkins Carl
Bought by
Roberts Gloria
Purchase Details
Closed on
Dec 3, 1997
Sold by
Porter Bessie
Bought by
Roberts Gloria
Purchase Details
Closed on
Jan 22, 1973
Sold by
Hopkins Shirley W and Echols Helen W
Bought by
Porter Jim
Create a Home Valuation Report for This Property
The Home Valuation Report is an in-depth analysis detailing your home's value as well as a comparison with similar homes in the area
Purchase History
| Date | Buyer | Sale Price | Title Company |
|---|---|---|---|
| Jernigan Charles Jr Tr | -- | -- | |
| Jernigan Charles B | $40,000 | -- | |
| Bank One National Association | -- | -- | |
| Metropolitan Mortgage Company | -- | -- | |
| Roberts Gloria | $1,000 | -- | |
| Roberts Gloria | $50,000 | -- | |
| Porter Jim | $1,500 | -- |
Source: Public Records
Mortgage History
| Date | Status | Borrower | Loan Amount |
|---|---|---|---|
| Open | Jernigan Charles Jr Tr | $54,000 |
Source: Public Records
Tax History
| Year | Tax Paid | Tax Assessment Tax Assessment Total Assessment is a certain percentage of the fair market value that is determined by local assessors to be the total taxable value of land and additions on the property. | Land | Improvement |
|---|---|---|---|---|
| 2025 | $1,956 | $118,436 | $1,920 | $116,516 |
| 2024 | $1,956 | $116,535 | $1,920 | $114,615 |
| 2023 | $1,941 | $114,588 | $1,920 | $112,668 |
| 2022 | $1,583 | $53,708 | $1,904 | $51,804 |
| 2021 | $1,673 | $51,513 | $1,904 | $49,609 |
| 2020 | $1,891 | $49,318 | $1,904 | $47,414 |
| 2019 | $1,254 | $32,723 | $1,904 | $30,819 |
| 2018 | $942 | $24,514 | $1,904 | $22,610 |
| 2017 | $73 | $1,904 | $1,904 | $0 |
| 2016 | $1,439 | $50,468 | $1,904 | $48,564 |
| 2015 | $935 | $50,468 | $1,904 | $48,564 |
| 2014 | $935 | $50,468 | $1,904 | $48,564 |
| 2013 | $935 | $50,468 | $1,904 | $48,564 |
Source: Public Records
Map
Nearby Homes
- 3231 Pear Ave
- 3532 Dallas St
- Tract 2 Jessica Ln
- 3442 Wildwood Ave
- 5525 E Railroad Ave
- 5518 W Railroad Ave
- 3540 Williams St
- 3548 Williams St
- 5574 Walkerville Rd
- 5772 Industrial Blvd
- Tract 2 Jessica Ln
- 5209 Georgia 32
- 5209 Ga Highway 32
- 3587 Cathleen Dr
- 6193 Offerman Loop
- 6162 Griner Rd
- 2114 Mill Creek Rd
- 6204 Cross Swamp Rd
- 5466 Robin Rd
- 5817 Cantrell Rd
- 3211 Oates St
- 5670 W Main St
- 5678 W Main St
- 3213 Peach Ave
- 3217 Oates St
- 3391 Tyre Bridge Rd
- 5684 W Main St
- 00 Peach Ave
- 0 Peach Ave
- 5650 W Main St
- 3405 Tyre Bridge Rd
- 5694 W Main St
- 3392 Tyre Bridge Rd
- 5671 W Main St
- 3382 Tyre Bridge Rd
- 3400 Tyre Bridge Rd
- 3400 Tyre Bridge Rd
- 5691 W Main St
- 5657 W Main St
- 3368 Tyre Bridge Rd