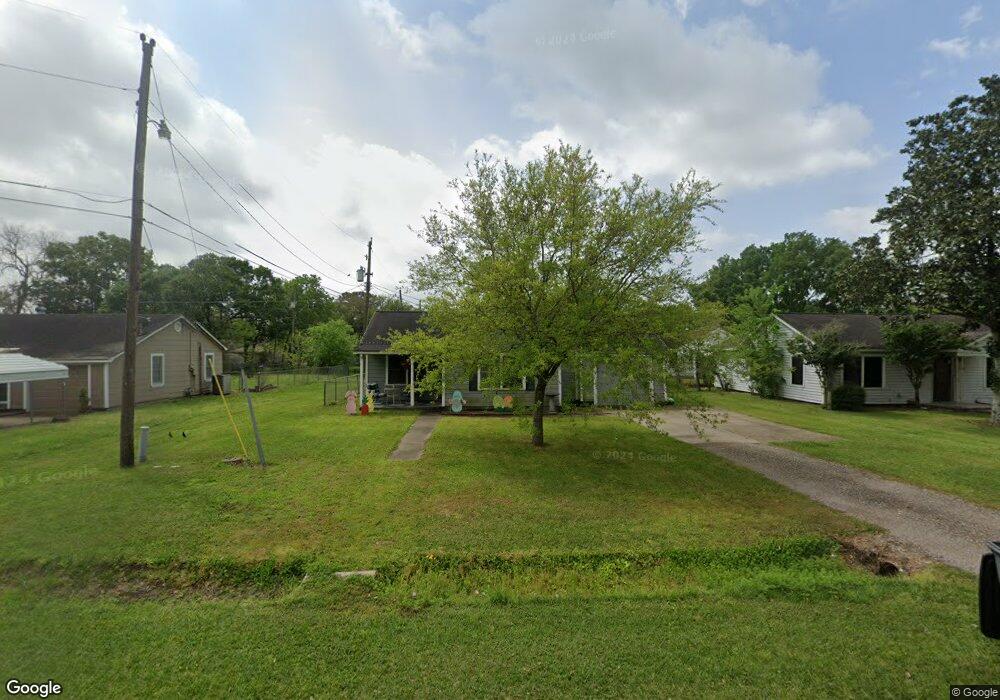
3204 10th St Bay City, TX 77414
Estimated Value: $104,253 - $165,000
--
Bed
--
Bath
974
Sq Ft
$137/Sq Ft
Est. Value
About This Home
This home is located at 3204 10th St, Bay City, TX 77414 and is currently estimated at $133,813, approximately $137 per square foot. 3204 10th St is a home located in Matagorda County with nearby schools including John H. Cherry Elementary School, Bay City Junior High School, and Bay City High School.
Ownership History
Date
Name
Owned For
Owner Type
Purchase Details
Closed on
Jan 18, 2017
Sold by
Martinez Pasqual and Martinez Delfina
Bought by
Avants Christen
Current Estimated Value
Purchase Details
Closed on
Jun 2, 2007
Sold by
Randall William E
Bought by
Maldonado Antonio I and Maldonado Monica M
Home Financials for this Owner
Home Financials are based on the most recent Mortgage that was taken out on this home.
Original Mortgage
$13,950
Interest Rate
6.16%
Mortgage Type
Purchase Money Mortgage
Create a Home Valuation Report for This Property
The Home Valuation Report is an in-depth analysis detailing your home's value as well as a comparison with similar homes in the area
Home Values in the Area
Average Home Value in this Area
Purchase History
| Date | Buyer | Sale Price | Title Company |
|---|---|---|---|
| Avants Christen | -- | None Available | |
| Maldonado Antonio I | -- | -- |
Source: Public Records
Mortgage History
| Date | Status | Borrower | Loan Amount |
|---|---|---|---|
| Previous Owner | Maldonado Antonio I | $13,950 |
Source: Public Records
Tax History Compared to Growth
Tax History
| Year | Tax Paid | Tax Assessment Tax Assessment Total Assessment is a certain percentage of the fair market value that is determined by local assessors to be the total taxable value of land and additions on the property. | Land | Improvement |
|---|---|---|---|---|
| 2024 | $18 | $101,380 | $27,390 | $73,990 |
| 2023 | $1,604 | $99,330 | $13,590 | $85,740 |
| 2022 | $1,671 | $64,340 | $9,800 | $54,540 |
| 2021 | $1,672 | $60,010 | $9,800 | $50,210 |
| 2020 | $1,581 | $51,730 | $9,800 | $41,930 |
| 2019 | $1,597 | $52,280 | $9,800 | $42,480 |
| 2018 | $1,573 | $53,410 | $9,800 | $43,610 |
| 2017 | $1,226 | $43,900 | $9,800 | $34,100 |
| 2016 | $1,226 | $43,900 | $9,800 | $34,100 |
| 2015 | -- | $46,140 | $9,800 | $36,340 |
| 2014 | -- | $45,680 | $9,800 | $35,880 |
Source: Public Records
Map
Nearby Homes