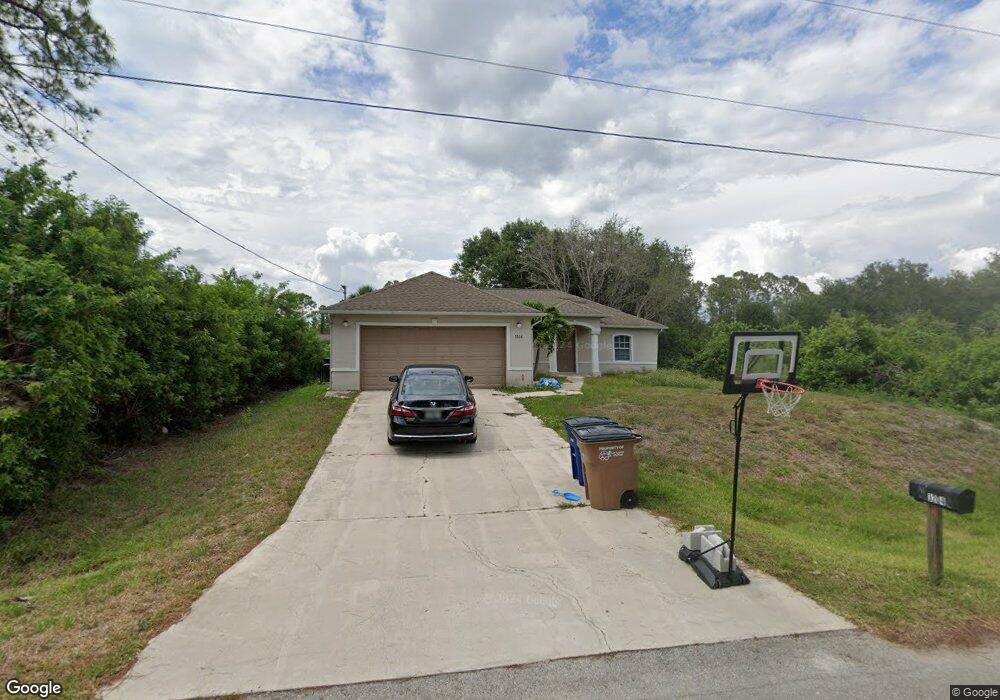
3204 17th St W Lehigh Acres, FL 33971
Richmond NeighborhoodEstimated Value: $249,000 - $272,000
3
Beds
2
Baths
1,314
Sq Ft
$198/Sq Ft
Est. Value
About This Home
This home is located at 3204 17th St W, Lehigh Acres, FL 33971 and is currently estimated at $260,333, approximately $198 per square foot. 3204 17th St W is a home located in Lee County with nearby schools including Lehigh Elementary School, Gateway Elementary School, and The Alva School.
Ownership History
Date
Name
Owned For
Owner Type
Purchase Details
Closed on
May 31, 2019
Sold by
2019 1 Ih Borrower Lp
Bought by
2019 1 Ih Borrower Lp
Current Estimated Value
Purchase Details
Closed on
Jul 18, 2014
Sold by
Austin & Shawn Real Estate Investments L
Bought by
Fellar Llc
Purchase Details
Closed on
Mar 5, 2014
Sold by
Fannie Mae
Bought by
Austin & Shawn Real Estate Investments L
Purchase Details
Closed on
Aug 9, 2013
Sold by
Johnson Jonathan
Bought by
Federal National Mortgage Association
Purchase Details
Closed on
Nov 27, 2007
Sold by
Brettweston Corp
Bought by
Johnson Jonathan
Home Financials for this Owner
Home Financials are based on the most recent Mortgage that was taken out on this home.
Original Mortgage
$164,900
Interest Rate
6.36%
Mortgage Type
Unknown
Purchase Details
Closed on
Jan 15, 2004
Sold by
Zander Walter
Bought by
Brettweston Corp
Create a Home Valuation Report for This Property
The Home Valuation Report is an in-depth analysis detailing your home's value as well as a comparison with similar homes in the area
Home Values in the Area
Average Home Value in this Area
Purchase History
| Date | Buyer | Sale Price | Title Company |
|---|---|---|---|
| 2019 1 Ih Borrower Lp | -- | Os National Llc | |
| Fellar Llc | $76,500 | Liberty Title & Escrow Co | |
| Austin & Shawn Real Estate Investments L | $51,500 | Bay National Title Company | |
| Federal National Mortgage Association | -- | None Available | |
| Johnson Jonathan | $164,900 | Patriot Title Services Llc | |
| Brettweston Corp | $4,000 | -- |
Source: Public Records
Mortgage History
| Date | Status | Borrower | Loan Amount |
|---|---|---|---|
| Previous Owner | Johnson Jonathan | $164,900 |
Source: Public Records
Tax History Compared to Growth
Tax History
| Year | Tax Paid | Tax Assessment Tax Assessment Total Assessment is a certain percentage of the fair market value that is determined by local assessors to be the total taxable value of land and additions on the property. | Land | Improvement |
|---|---|---|---|---|
| 2025 | $3,099 | $198,726 | $20,995 | $177,731 |
| 2024 | $3,099 | $191,384 | -- | -- |
| 2023 | $3,099 | $173,985 | $0 | $0 |
| 2022 | $2,762 | $158,168 | $0 | $0 |
| 2021 | $2,369 | $143,789 | $5,800 | $137,989 |
| 2020 | $2,302 | $134,855 | $5,000 | $129,855 |
| 2019 | $2,351 | $134,052 | $5,000 | $129,052 |
| 2018 | $2,223 | $123,544 | $5,000 | $118,544 |
| 2017 | $2,048 | $117,081 | $4,200 | $112,881 |
| 2016 | $1,855 | $97,629 | $4,200 | $93,429 |
| 2015 | $1,707 | $85,302 | $4,000 | $81,302 |
| 2014 | -- | $64,392 | $2,715 | $61,677 |
| 2013 | -- | $60,502 | $2,400 | $58,102 |
Source: Public Records
Map
Nearby Homes
- 3204 17th St W
- 3205 18th St W
- 3205 18th St W Unit 6
- 3208 17th St W
- 3207 18th St W
- 3207 18th St W
- 3203 17th St W
- 3203 E 17th St Unit 12
- 3203 E 17th St
- 3209 18th St W
- 3209 18th St W
- 3209 18th St W Unit 17
- 3209 17th St W
- 3210 17th St W
- 3211 17th St W
- 3212 17th St W
- 3204 18th St W
- 3206 18th St W
- 3206 16th St W
- 3200 18th St W Unit 6