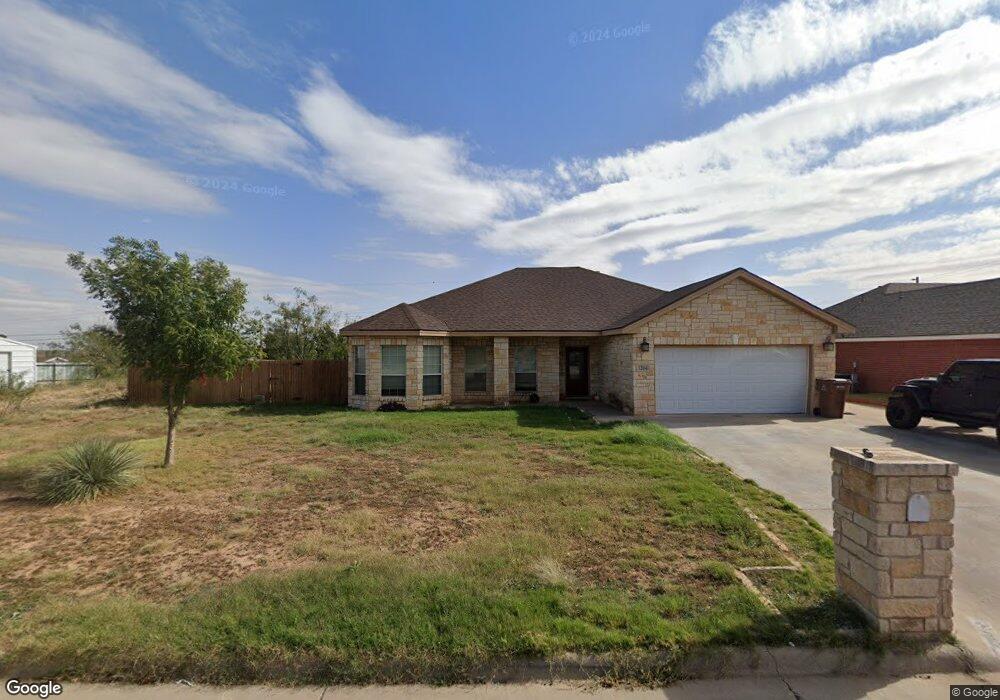
3204 Fenn St Big Spring, TX 79720
Estimated Value: $243,000 - $304,000
--
Bed
--
Bath
2,567
Sq Ft
$108/Sq Ft
Est. Value
About This Home
This home is located at 3204 Fenn St, Big Spring, TX 79720 and is currently estimated at $277,705, approximately $108 per square foot. 3204 Fenn St is a home located in Howard County with nearby schools including Big Spring High School.
Ownership History
Date
Name
Owned For
Owner Type
Purchase Details
Closed on
Jan 6, 2023
Sold by
Marsh Christopher Jaques
Bought by
Granados Michelle Ernie
Current Estimated Value
Purchase Details
Closed on
Jan 3, 2018
Sold by
National Residential Nominee Services In
Bought by
Wegner Grayson Scott
Home Financials for this Owner
Home Financials are based on the most recent Mortgage that was taken out on this home.
Original Mortgage
$200,000
Interest Rate
3.92%
Mortgage Type
VA
Purchase Details
Closed on
Mar 8, 2012
Sold by
Jones John D
Bought by
Steeg Randy Ver and Steeg Jeri Ver
Home Financials for this Owner
Home Financials are based on the most recent Mortgage that was taken out on this home.
Original Mortgage
$136,725
Interest Rate
3.9%
Mortgage Type
Construction
Purchase Details
Closed on
Jun 27, 2007
Sold by
Partee Stan
Bought by
Gibson Rommy and Gibson Robbie
Create a Home Valuation Report for This Property
The Home Valuation Report is an in-depth analysis detailing your home's value as well as a comparison with similar homes in the area
Home Values in the Area
Average Home Value in this Area
Purchase History
| Date | Buyer | Sale Price | Title Company |
|---|---|---|---|
| Granados Michelle Ernie | -- | Surety Title | |
| Wegner Grayson Scott | -- | Surety Title Company | |
| Steeg Randy Ver | -- | Big Spring Abstract | |
| Gibson Rommy | -- | None Available |
Source: Public Records
Mortgage History
| Date | Status | Borrower | Loan Amount |
|---|---|---|---|
| Previous Owner | Wegner Grayson Scott | $200,000 | |
| Previous Owner | Steeg Randy Ver | $136,725 |
Source: Public Records
Tax History Compared to Growth
Tax History
| Year | Tax Paid | Tax Assessment Tax Assessment Total Assessment is a certain percentage of the fair market value that is determined by local assessors to be the total taxable value of land and additions on the property. | Land | Improvement |
|---|---|---|---|---|
| 2024 | $3,939 | $285,235 | $10,950 | $274,285 |
| 2023 | $3,547 | $285,235 | $10,950 | $274,285 |
| 2022 | $4,628 | $285,235 | $10,950 | $274,285 |
| 2021 | $4,844 | $206,113 | $10,950 | $195,163 |
| 2020 | $4,901 | $206,113 | $10,950 | $195,163 |
| 2019 | $5,506 | $217,645 | $10,950 | $206,695 |
| 2018 | $6,553 | $218,720 | $10,950 | $207,770 |
| 2017 | $5,425 | $184,305 | $10,950 | $173,355 |
| 2016 | $5,451 | $185,200 | $10,950 | $174,250 |
| 2015 | -- | $186,092 | $10,950 | $175,142 |
| 2014 | -- | $175,875 | $10,950 | $164,925 |
Source: Public Records
Map
Nearby Homes
- 3308 Fordham Ave
- 3210 Fordham Ave
- 3231 Drexel Ave
- 3310 Fenn St
- 3412 Fordham Ave
- 3207 Drexel Ave
- 3206 Drexel Ave
- 3230 Cornell Ave
- 703 Baylor Blvd
- 701 Baylor Blvd
- 1104 S Monticello St
- 704 Bucknell Ave
- 717 Tulane Ave
- 623 Tulane Ave
- 0000 E I-20
- 1108 Stanford Ave
- 1210 Marijo Ave
- 1309 Marijo Ave
- 1722 Yale Ave
- 1404 Marijo Ave