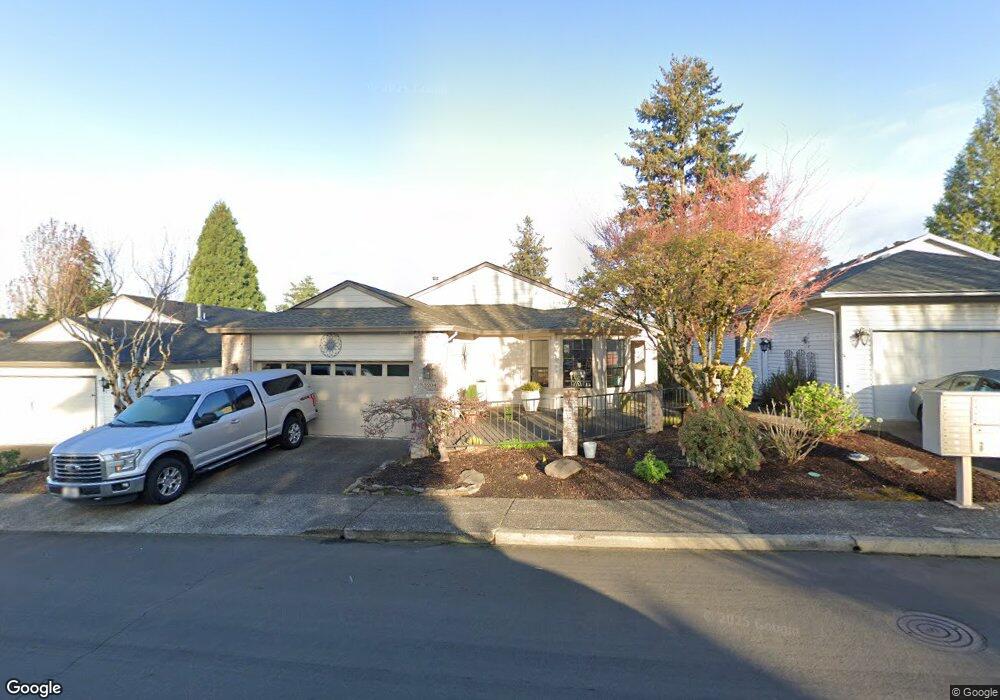
3204 SE 157th Ave Unit 8 Vancouver, WA 98683
Cascade Park NeighborhoodEstimated Value: $636,000 - $669,000
3
Beds
2
Baths
1,696
Sq Ft
$384/Sq Ft
Est. Value
About This Home
This home is located at 3204 SE 157th Ave Unit 8, Vancouver, WA 98683 and is currently estimated at $651,004, approximately $383 per square foot. 3204 SE 157th Ave Unit 8 is a home located in Clark County with nearby schools including Riverview Elementary School, Shahala Middle School, and Mountain View High School.
Ownership History
Date
Name
Owned For
Owner Type
Purchase Details
Closed on
Dec 17, 2019
Sold by
Mastrantonio Robert H and Mastrantonio Roberta L
Bought by
Mastrantonio Roberta L and Mastrantonio Robert H
Current Estimated Value
Purchase Details
Closed on
Jan 20, 2011
Sold by
Scott Naomi R
Bought by
Mastrantonio Robert H and Mastrantonio Roberta L
Purchase Details
Closed on
Sep 27, 1999
Sold by
Mccoy Elizabeth P
Bought by
Scott Tim W and Scott Naomi R
Home Financials for this Owner
Home Financials are based on the most recent Mortgage that was taken out on this home.
Original Mortgage
$128,300
Interest Rate
7.97%
Purchase Details
Closed on
Aug 30, 1995
Sold by
Mccoy Robert N
Bought by
Mccoy Elizabeth P
Home Financials for this Owner
Home Financials are based on the most recent Mortgage that was taken out on this home.
Original Mortgage
$25,000
Interest Rate
6%
Mortgage Type
Seller Take Back
Create a Home Valuation Report for This Property
The Home Valuation Report is an in-depth analysis detailing your home's value as well as a comparison with similar homes in the area
Home Values in the Area
Average Home Value in this Area
Purchase History
| Date | Buyer | Sale Price | Title Company |
|---|---|---|---|
| Mastrantonio Roberta L | -- | None Available | |
| Mastrantonio Robert H | $237,500 | None Available | |
| Scott Tim W | $224,355 | Chicago Title Insurance Co | |
| Mccoy Elizabeth P | -- | -- |
Source: Public Records
Mortgage History
| Date | Status | Borrower | Loan Amount |
|---|---|---|---|
| Previous Owner | Scott Tim W | $128,300 | |
| Previous Owner | Mccoy Elizabeth P | $25,000 |
Source: Public Records
Tax History Compared to Growth
Tax History
| Year | Tax Paid | Tax Assessment Tax Assessment Total Assessment is a certain percentage of the fair market value that is determined by local assessors to be the total taxable value of land and additions on the property. | Land | Improvement |
|---|---|---|---|---|
| 2025 | $5,530 | $578,442 | $235,000 | $343,442 |
| 2024 | $5,389 | $557,600 | $235,000 | $322,600 |
| 2023 | $5,109 | $563,767 | $227,500 | $336,267 |
| 2022 | $4,502 | $527,979 | $218,750 | $309,229 |
| 2021 | $4,267 | $441,198 | $182,000 | $259,198 |
| 2020 | $4,245 | $395,231 | $175,000 | $220,231 |
| 2019 | $3,932 | $396,948 | $175,000 | $221,948 |
| 2018 | $4,299 | $395,930 | $0 | $0 |
| 2017 | $3,924 | $347,993 | $0 | $0 |
| 2016 | $3,754 | $328,904 | $0 | $0 |
| 2015 | $3,670 | $301,264 | $0 | $0 |
| 2014 | -- | $281,565 | $0 | $0 |
| 2013 | -- | $240,439 | $0 | $0 |
Source: Public Records
Map
Nearby Homes
- 15701 SE 34th Cir
- 3112 SE 156th Ave Unit 7
- 15815 SE 35th St
- 3009 SE 155th Ave
- 3205 SE 153rd Ave
- 15907 SE 29th St
- 3911 SE 157th Ave
- 15203 SE Northshore Dr
- 0 SE Evergreen Hwy Unit 147631456
- 0 SE Evergreen Hwy Unit 211246418
- 2606 SE Baypoint Dr Unit 20
- 3612 SE 165th Ave
- 2512 SE Baypoint Dr Unit 37
- 2512 SE Baypoint Dr Unit 38
- 4305 SE 159th Ct
- 2403 SE Balboa Dr
- 16508 SE 39th St
- 15405 SE Graham Rd
- 3708 SE 167th Ct
- 15719 SE 23rd St Unit 118
- 3114 SE 157th Ave
- 3208 SE 157th Ave
- 3106 SE 157th Ave Unit 8
- 3207 SE 156th Ave
- 3216 SE 157th Ave Unit 8
- 3203 SE 156th Ave
- 3211 SE 156th Ave Unit 7
- 3117 SE 156th Ave
- 3102 SE 157th Ave
- 3215 SE 156th Ave Unit 7
- 3207 SE 157th Ave Unit 8
- 3220 SE 157th Ave
- 3115 SE 157th Ave
- 3113 SE 156th Ave
- 3107 SE 157th Ave
- 3219 SE 156th Ave
- 3216 SE Spyglass Dr
- 19302 SE 33rd St
- 3103 SE 157th Ave
- 19303 SE 33rd St