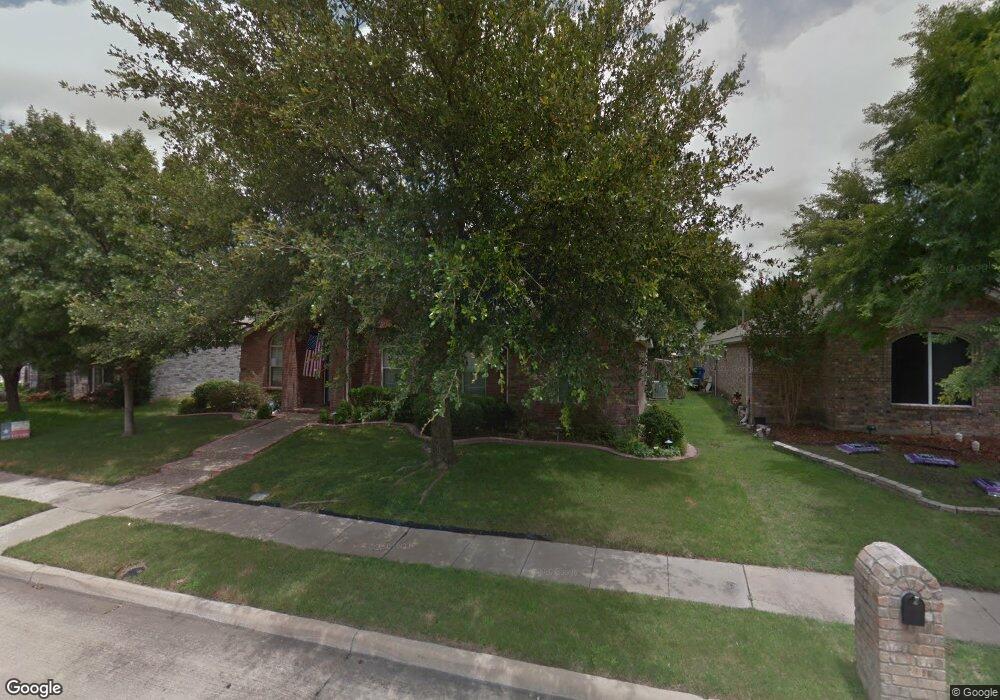
3205 Avery Ln McKinney, TX 75070
Eldorado Heights NeighborhoodEstimated Value: $434,000 - $471,000
4
Beds
2
Baths
2,189
Sq Ft
$207/Sq Ft
Est. Value
About This Home
This home is located at 3205 Avery Ln, McKinney, TX 75070 and is currently estimated at $453,022, approximately $206 per square foot. 3205 Avery Ln is a home located in Collin County with nearby schools including Reuben Johnson Elementary School, Leonard Evans Jr Middle School, and Mckinney High School.
Ownership History
Date
Name
Owned For
Owner Type
Purchase Details
Closed on
Dec 20, 2005
Sold by
Grell Kirk and Grell Vicki
Bought by
Spear Paul R and Spear Deborah R
Current Estimated Value
Home Financials for this Owner
Home Financials are based on the most recent Mortgage that was taken out on this home.
Original Mortgage
$39,000
Outstanding Balance
$21,743
Interest Rate
6.23%
Mortgage Type
Fannie Mae Freddie Mac
Estimated Equity
$431,279
Purchase Details
Closed on
Feb 21, 2003
Sold by
Brewer Brandon J and Brewer Kathryn
Bought by
Grell Kirk and Grell Vicki
Home Financials for this Owner
Home Financials are based on the most recent Mortgage that was taken out on this home.
Original Mortgage
$128,000
Interest Rate
5.93%
Purchase Details
Closed on
Sep 30, 1999
Sold by
Engle Homes/Texas Inc
Bought by
Brewer Brandon J and Brewer Kathryn
Home Financials for this Owner
Home Financials are based on the most recent Mortgage that was taken out on this home.
Original Mortgage
$114,600
Interest Rate
7.83%
Create a Home Valuation Report for This Property
The Home Valuation Report is an in-depth analysis detailing your home's value as well as a comparison with similar homes in the area
Home Values in the Area
Average Home Value in this Area
Purchase History
| Date | Buyer | Sale Price | Title Company |
|---|---|---|---|
| Spear Paul R | -- | Tt | |
| Grell Kirk | -- | -- | |
| Brewer Brandon J | -- | -- |
Source: Public Records
Mortgage History
| Date | Status | Borrower | Loan Amount |
|---|---|---|---|
| Open | Spear Paul R | $39,000 | |
| Previous Owner | Grell Kirk | $128,000 | |
| Previous Owner | Brewer Brandon J | $114,600 | |
| Closed | Brewer Brandon J | $21,500 | |
| Closed | Grell Kirk | $24,000 |
Source: Public Records
Tax History Compared to Growth
Tax History
| Year | Tax Paid | Tax Assessment Tax Assessment Total Assessment is a certain percentage of the fair market value that is determined by local assessors to be the total taxable value of land and additions on the property. | Land | Improvement |
|---|---|---|---|---|
| 2025 | $2,365 | $430,767 | $130,000 | $341,395 |
| 2024 | $2,365 | $391,606 | $120,000 | $352,210 |
| 2023 | $2,365 | $356,005 | $95,000 | $367,439 |
| 2022 | $6,486 | $323,641 | $95,000 | $300,396 |
| 2021 | $6,248 | $294,219 | $65,000 | $229,219 |
| 2020 | $6,230 | $275,656 | $65,000 | $210,656 |
| 2019 | $6,407 | $269,536 | $65,000 | $204,536 |
| 2018 | $6,590 | $270,948 | $65,000 | $207,088 |
| 2017 | $5,991 | $256,313 | $60,000 | $196,313 |
| 2016 | $5,559 | $236,452 | $55,000 | $181,452 |
| 2015 | $3,930 | $208,754 | $45,000 | $163,754 |
Source: Public Records
Map
Nearby Homes
- 3108 Westview Dr
- 3109 Westview Dr
- 3112 Avery Ln
- 3106 Valley Crest Dr
- 3125 Stone Forest Cir
- 3005 Avery Ln
- 4829 Cedar Crest Dr
- 3000 Avery Ln
- 3107 Melrose Dr
- 4925 Stone Gate Trail
- 4908 Heather Glen Trail
- 4949 Stone Gate Trail
- 3300 Jacobs Dr
- 3400 Westview Dr
- 4607 Green Meadow Dr
- 4504 Courtside Dr
- 5004 Rain Forest Dr
- 5101 Geranium Ct
- 3400 Almond Ln
- 5112 Golden Wheat Ln
- 3209 Avery Ln
- 3201 Avery Ln
- 3213 Avery Ln
- 3116 Westview Dr
- 3121 Avery Ln
- 3114 Westview Dr
- 2001 Auburn St Unit 403
- 4901 Auburn Dr
- 3200 Westview Dr
- 3112 Westview Dr
- 3208 Avery Ln
- 3110 Westview Dr
- 3217 Avery Ln
- 3117 Avery Ln
- 3202 Westview Dr
- 4905 Auburn Dr
- 3212 Avery Ln
- 3116 Avery Ln
- 3204 Westview Dr
- 3113 Avery Ln