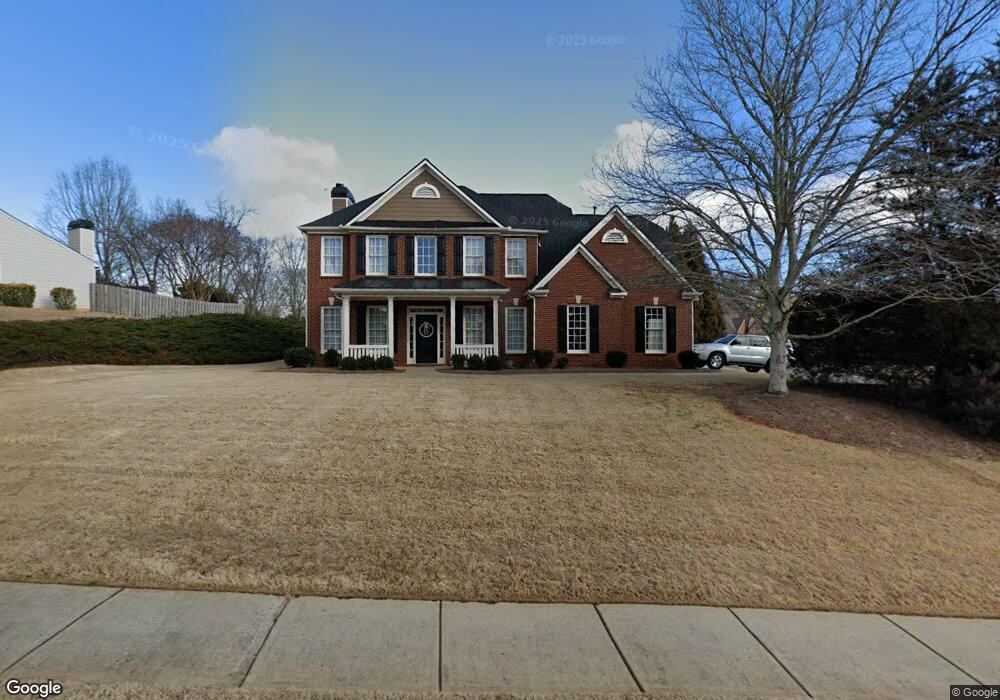
3205 Greenfern Ct Alpharetta, GA 30004
Estimated Value: $553,000 - $634,000
4
Beds
3
Baths
2,623
Sq Ft
$227/Sq Ft
Est. Value
About This Home
This home is located at 3205 Greenfern Ct, Alpharetta, GA 30004 and is currently estimated at $596,289, approximately $227 per square foot. 3205 Greenfern Ct is a home located in Forsyth County with nearby schools including Brandywine Elementary School, DeSana Middle School, and Denmark High School.
Ownership History
Date
Name
Owned For
Owner Type
Purchase Details
Closed on
Jul 2, 2014
Sold by
Walker Nenjamin S
Bought by
Walker Benjamin S and Walker Rebecca M
Current Estimated Value
Home Financials for this Owner
Home Financials are based on the most recent Mortgage that was taken out on this home.
Original Mortgage
$224,000
Outstanding Balance
$170,877
Interest Rate
4.2%
Mortgage Type
New Conventional
Estimated Equity
$425,412
Purchase Details
Closed on
Sep 17, 2004
Sold by
Mammola Catherine T
Bought by
Walker Scott
Home Financials for this Owner
Home Financials are based on the most recent Mortgage that was taken out on this home.
Original Mortgage
$198,800
Interest Rate
4.87%
Mortgage Type
New Conventional
Purchase Details
Closed on
Aug 11, 2000
Sold by
D R Horton Inc & Torrey
Bought by
Mammola Catherine T
Home Financials for this Owner
Home Financials are based on the most recent Mortgage that was taken out on this home.
Original Mortgage
$151,000
Interest Rate
8.07%
Mortgage Type
New Conventional
Create a Home Valuation Report for This Property
The Home Valuation Report is an in-depth analysis detailing your home's value as well as a comparison with similar homes in the area
Home Values in the Area
Average Home Value in this Area
Purchase History
| Date | Buyer | Sale Price | Title Company |
|---|---|---|---|
| Walker Benjamin S | -- | -- | |
| Walker Scott | $248,500 | -- | |
| Mammola Catherine T | $215,000 | -- |
Source: Public Records
Mortgage History
| Date | Status | Borrower | Loan Amount |
|---|---|---|---|
| Open | Walker Benjamin S | $224,000 | |
| Previous Owner | Walker Scott | $198,800 | |
| Previous Owner | Mammola Catherine T | $151,000 |
Source: Public Records
Tax History Compared to Growth
Tax History
| Year | Tax Paid | Tax Assessment Tax Assessment Total Assessment is a certain percentage of the fair market value that is determined by local assessors to be the total taxable value of land and additions on the property. | Land | Improvement |
|---|---|---|---|---|
| 2025 | $4,933 | $220,764 | $68,000 | $152,764 |
| 2024 | $4,933 | $201,164 | $68,000 | $133,164 |
| 2023 | $4,766 | $193,636 | $60,000 | $133,636 |
| 2022 | $4,164 | $130,880 | $40,000 | $90,880 |
| 2021 | $3,614 | $130,880 | $40,000 | $90,880 |
| 2020 | $3,505 | $126,940 | $40,000 | $86,940 |
| 2019 | $3,348 | $121,080 | $40,000 | $81,080 |
| 2018 | $3,163 | $114,380 | $32,000 | $82,380 |
| 2017 | $2,819 | $101,556 | $32,000 | $69,556 |
| 2016 | $2,597 | $93,556 | $24,000 | $69,556 |
| 2015 | $2,546 | $91,556 | $22,000 | $69,556 |
| 2014 | $2,191 | $82,776 | $22,000 | $60,776 |
Source: Public Records
Map
Nearby Homes
- 255 White Pines Dr
- 472 Grayson Way
- 419 Grayson Way
- 1550 Township Cir
- 368 Grayson Way
- 1615 Waverly Glen Dr
- 1620 Woodall View Ct
- 409 Windstone Trail
- 1245 Overland Crossing
- 1405 Overland Crossing
- 406 Weatherstone Place
- 1293 Dalesford Dr
- 1255 Faircrest Crossing Dr
- 1130 Pennington View Ln
- 1345 Faircrest Ln
- 1570 Winshire Cove
- 3692 Archgate Ct
- 1425 Faircrest Ln
- 3260 Chadbourne Trail
- 3315 Woodside Cir
- 3210 Greenfern Ct
- 3330 Chadbourne Trail
- 0 Chadbourne Trail Unit 3172792
- 0 Chadbourne Trail Unit 7374183
- 0 Chadbourne Trail Unit 7268984
- 0 Chadbourne Trail Unit 7266470
- 0 Chadbourne Trail Unit 7033965
- 0 Chadbourne Trail Unit 3161093
- 0 Chadbourne Trail Unit 8885336
- 0 Chadbourne Trail Unit 8765623
- 0 Chadbourne Trail Unit 8649944
- 0 Chadbourne Trail Unit 8460301
- 0 Chadbourne Trail Unit 8297096
- 0 Chadbourne Trail Unit 8224781
- 0 Chadbourne Trail Unit 7554090
- 0 Chadbourne Trail Unit 7303426
- 0 Chadbourne Trail
- 0 Greenfern Ct Unit 7290475