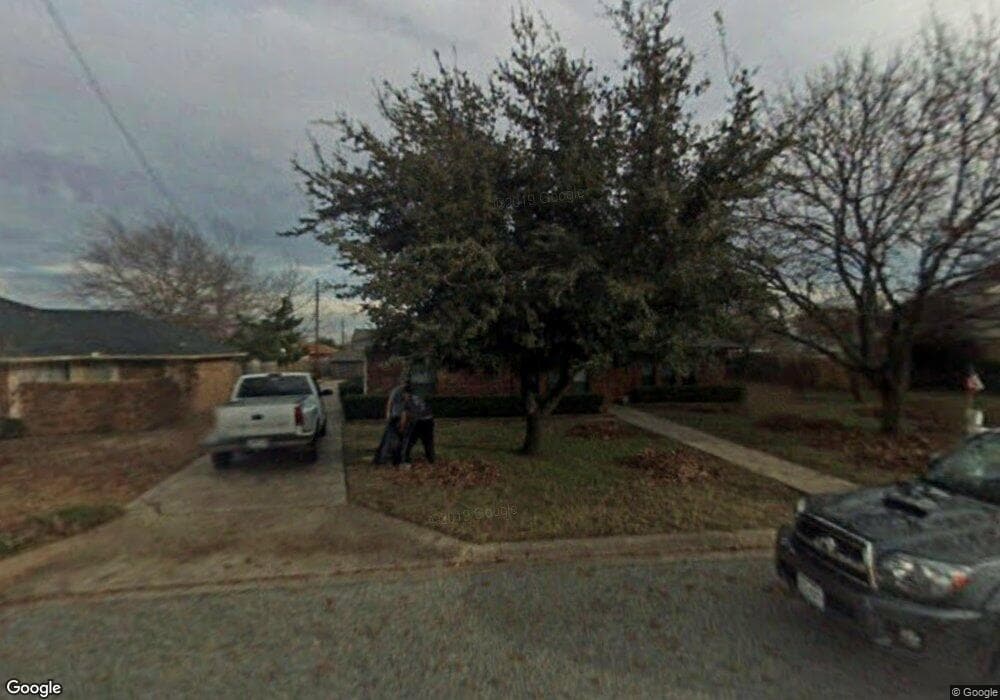
3205 N Marseille St Sherman, TX 75090
Estimated Value: $216,568 - $226,000
3
Beds
2
Baths
1,429
Sq Ft
$155/Sq Ft
Est. Value
About This Home
This home is located at 3205 N Marseille St, Sherman, TX 75090 and is currently estimated at $221,284, approximately $154 per square foot. 3205 N Marseille St is a home located in Grayson County with nearby schools including Percy W. Neblett Elementary School, Dillingham Intermediate School, and Piner Middle School.
Ownership History
Date
Name
Owned For
Owner Type
Purchase Details
Closed on
May 16, 2024
Sold by
Hutson Donna Renee
Bought by
Haas Family Trust and Haas
Current Estimated Value
Purchase Details
Closed on
Jun 12, 2015
Sold by
Culpepper Byron and Culpepper Shirley
Bought by
Tackett Luther M and Tackett Jodene J
Purchase Details
Closed on
Jun 21, 2010
Sold by
Bennett John W
Bought by
Culpepper Byron and Culpepper Shirley
Home Financials for this Owner
Home Financials are based on the most recent Mortgage that was taken out on this home.
Original Mortgage
$96,500
Interest Rate
4.6%
Mortgage Type
New Conventional
Purchase Details
Closed on
Aug 27, 2004
Sold by
Bennett Euleta Louise
Bought by
Bennett John W
Create a Home Valuation Report for This Property
The Home Valuation Report is an in-depth analysis detailing your home's value as well as a comparison with similar homes in the area
Home Values in the Area
Average Home Value in this Area
Purchase History
| Date | Buyer | Sale Price | Title Company |
|---|---|---|---|
| Haas Family Trust | -- | Red River Title | |
| Tackett Luther M | -- | Red River Title Co | |
| Culpepper Byron | -- | Chapin Title Co Inc | |
| Bennett John W | -- | -- | |
| Bennett Euleta Louise | -- | -- |
Source: Public Records
Mortgage History
| Date | Status | Borrower | Loan Amount |
|---|---|---|---|
| Previous Owner | Culpepper Byron | $96,500 |
Source: Public Records
Tax History Compared to Growth
Tax History
| Year | Tax Paid | Tax Assessment Tax Assessment Total Assessment is a certain percentage of the fair market value that is determined by local assessors to be the total taxable value of land and additions on the property. | Land | Improvement |
|---|---|---|---|---|
| 2025 | $4,733 | $225,278 | $64,832 | $160,446 |
| 2024 | $4,733 | $215,780 | $64,155 | $151,625 |
| 2023 | $939 | $214,434 | $0 | $0 |
| 2022 | $4,569 | $194,940 | $0 | $0 |
| 2021 | $4,442 | $188,175 | $30,330 | $157,845 |
| 2020 | $4,228 | $162,521 | $30,330 | $132,191 |
| 2019 | $3,948 | $146,461 | $10,035 | $136,426 |
| 2018 | $3,349 | $133,483 | $10,035 | $123,448 |
| 2017 | $3,166 | $127,186 | $10,035 | $117,151 |
| 2016 | $2,977 | $119,574 | $10,035 | $109,539 |
| 2015 | $1,472 | $97,089 | $10,035 | $87,054 |
| 2014 | $1,596 | $93,607 | $10,035 | $83,572 |
Source: Public Records
Map
Nearby Homes
- 1705 La Salle Dr
- TBD N Calais St
- 25 Luther Ln
- 3707 Sumner Ct
- 805 La Salle Dr
- 815 E Pecan Grove Rd
- 2.18 Acres E Sara Swamy Dr
- 95 Meadowlake
- 1719 Moreland Dr
- 914 Boone Dr
- 2606 Bennett Ave
- 1516 E Peyton St
- 15.125 acres E Peyton St
- 705 E Lamberth Rd
- TBD E Canyon Grove Rd
- 3706 Heatherwood Ln
- 2700 E Us-82
- 2012 Texoma Pkwy
- 1705 E Hilton St
- 3707 Heatherwood Ln
- 3205 N Marseille Ln
- 3209 N Marseille Ln
- 3209 N Marseille St
- 3201 N Marseille St
- 3114 Normandy Dr
- 3118 Normandy Dr
- 3110 Normandy Dr
- 3213 N Marseille St
- 3202 Normandy Dr
- 3206 N Marseille St
- 3210 N Marseille St
- 1418 E Marseille Ln
- 3206 Normandy Dr
- 3214 N Marseille St
- 3217 N Marseille Ln
- 3106 Normandy Dr
- 3200 N Marseille St
- 3217 N Marseille St
- 3210 Normandy Dr
- 3218 N Marseille St