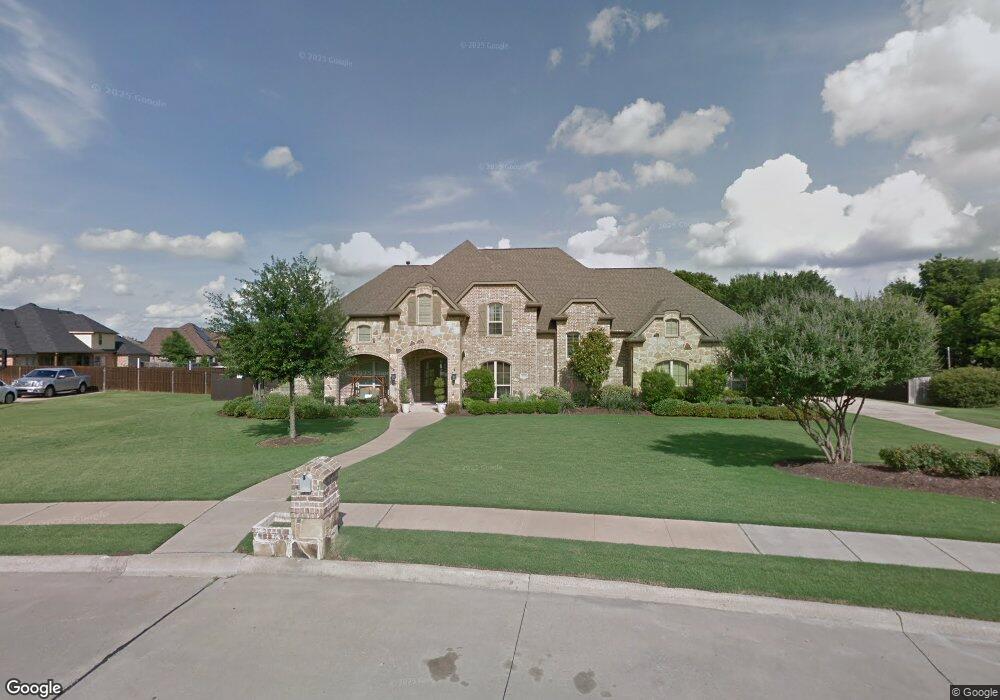
3206 Bent Creek Ct Midlothian, TX 76065
Estimated Value: $782,922
4
Beds
3
Baths
3,975
Sq Ft
$197/Sq Ft
Est. Value
About This Home
This home is located at 3206 Bent Creek Ct, Midlothian, TX 76065 and is currently estimated at $782,922, approximately $196 per square foot. 3206 Bent Creek Ct is a home located in Ellis County with nearby schools including Larue Miller Elementary School and Frank Seale Middle School.
Ownership History
Date
Name
Owned For
Owner Type
Purchase Details
Closed on
Jun 22, 2016
Sold by
Caidwell Red Oak Ltd
Bought by
Jhh Century Llc
Current Estimated Value
Purchase Details
Closed on
May 5, 2015
Sold by
Houston John Howard and Houston Tracy Michelle
Bought by
Harvey Todd and Harvey Jana
Home Financials for this Owner
Home Financials are based on the most recent Mortgage that was taken out on this home.
Original Mortgage
$399,920
Interest Rate
3.74%
Mortgage Type
New Conventional
Purchase Details
Closed on
Dec 8, 2014
Sold by
Houston John Howard and Houston Tracy Michell
Bought by
Houston John Howard and Houston Tracy Michelle
Purchase Details
Closed on
Mar 12, 2010
Sold by
Byrum Heidi
Bought by
Houston John H and Houston Tracy M
Home Financials for this Owner
Home Financials are based on the most recent Mortgage that was taken out on this home.
Original Mortgage
$380,000
Interest Rate
4.93%
Purchase Details
Closed on
Dec 3, 2008
Sold by
Byrum Shawn L
Bought by
Byrum Heidi
Create a Home Valuation Report for This Property
The Home Valuation Report is an in-depth analysis detailing your home's value as well as a comparison with similar homes in the area
Home Values in the Area
Average Home Value in this Area
Purchase History
| Date | Buyer | Sale Price | Title Company |
|---|---|---|---|
| Jhh Century Llc | -- | None Available | |
| Harvey Todd | -- | None Available | |
| Houston John Howard | -- | None Available | |
| Houston John H | -- | -- | |
| Byrum Heidi | -- | -- |
Source: Public Records
Mortgage History
| Date | Status | Borrower | Loan Amount |
|---|---|---|---|
| Previous Owner | Harvey Todd | $399,920 | |
| Previous Owner | Houston John H | $380,000 |
Source: Public Records
Tax History Compared to Growth
Tax History
| Year | Tax Paid | Tax Assessment Tax Assessment Total Assessment is a certain percentage of the fair market value that is determined by local assessors to be the total taxable value of land and additions on the property. | Land | Improvement |
|---|---|---|---|---|
| 2025 | $11,040 | $650,029 | $140,000 | $510,029 |
| 2024 | $11,040 | $685,242 | -- | -- |
| 2023 | $11,040 | $622,947 | $0 | $0 |
| 2022 | $12,688 | $566,315 | $0 | $0 |
| 2021 | $12,183 | $517,880 | $86,250 | $431,630 |
| 2020 | $11,773 | $514,720 | $84,000 | $430,720 |
| 2019 | $11,142 | $506,550 | $0 | $0 |
| 2018 | $8,954 | $500,580 | $60,000 | $440,580 |
| 2017 | $7,221 | $539,480 | $60,000 | $479,480 |
| 2016 | $6,565 | $319,670 | $60,000 | $259,670 |
| 2015 | $8,817 | $442,360 | $60,000 | $382,360 |
| 2014 | $8,817 | $430,390 | $0 | $0 |
Source: Public Records
Map
Nearby Homes
- 1842 Plum Creek Dr
- 1817 Sunbeam Ct
- 3420 Sudith Ln
- 1666 Plum Creek Dr
- 3601 Plum Creek Ct
- 1859 Ashford Ln
- 3470 Oak Tree Ln
- 3481 Oak Tree Ln
- 2250 Whispering Hills Dr
- 2454 Savanna Cir
- Lot 1 Tbd Ln
- 3870 Ledgestone Ln
- 1809 Sunlit Ct
- Lavender Plan at Goodland - Classic Series
- Chamberlaine Plan at Goodland - Manor Series
- Ormand Plan at Goodland - Garden Series
- Tulip Plan at Goodland - Classic Series
- Bluebonnet Plan at Goodland - Classic Series
- Beeville Plan at Goodland - Manor Series
- Chadbury Plan at Goodland - Garden Series
- 3210 Bent Creek Ct
- 3202 Bent Creek Cour SW 3202 Bent Creek Ct
- 3202 Bent Creek Ct
- 3205 Bent Creek Ct
- 1433 Plum Creek Dr
- 1605 Plum Creek Dr
- 1845 Plum Creek Dr
- 1849 Plum Creek Dr
- 3214 Bent Creek Ct
- 1429 Plum Creek Dr
- 3209 Bent Creek Ct
- 1841 Plum Creek Dr
- 1609 Plum Creek Dr
- 3213 Bent Creek Ct
- 1837 Plum Creek Dr
- 1425 Plum Creek Dr
- 1438 Plum Creek Dr
- 1613 Plum Creek Dr
- 1434 Plum Creek Dr
- 1602 Plum Creek Dr