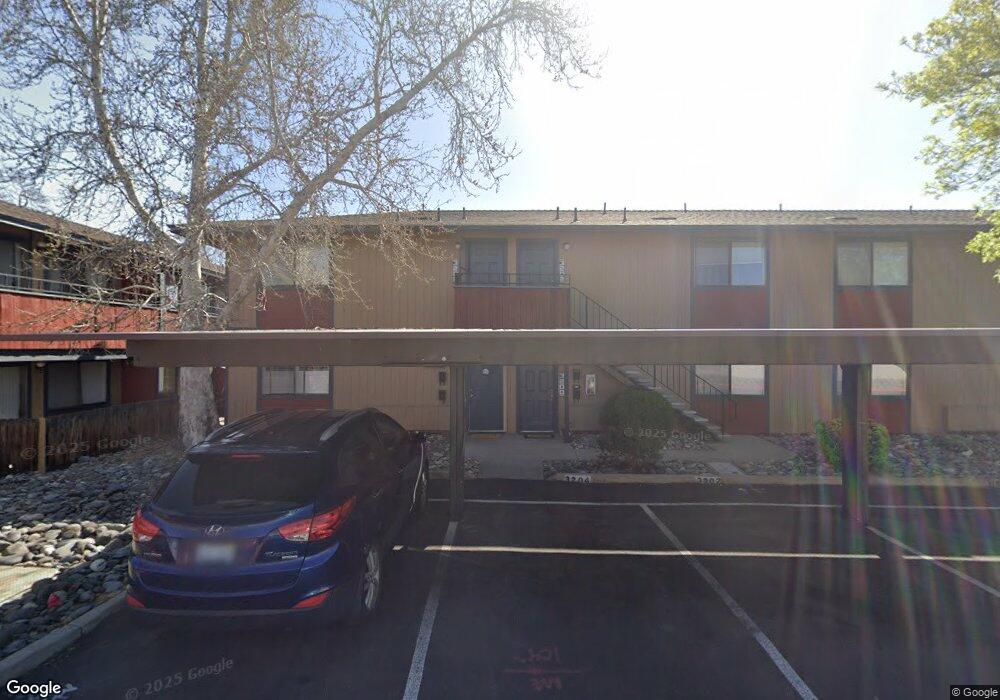
3206 Bristle Branch Dr Unit 68B Sparks, NV 89434
Reed NeighborhoodEstimated Value: $193,398 - $223,000
1
Bed
1
Bath
672
Sq Ft
$303/Sq Ft
Est. Value
About This Home
This home is located at 3206 Bristle Branch Dr Unit 68B, Sparks, NV 89434 and is currently estimated at $203,600, approximately $302 per square foot. 3206 Bristle Branch Dr Unit 68B is a home located in Washoe County with nearby schools including Hershal H. Beam Elementary School, Lena Juniper Elementary School, and Lou Mendive Middle School.
Ownership History
Date
Name
Owned For
Owner Type
Purchase Details
Closed on
Jul 17, 2015
Sold by
Rogers Delinda L
Bought by
The Delinda L Rogers Trust
Current Estimated Value
Purchase Details
Closed on
Jan 9, 2004
Sold by
Keighley James R
Bought by
Rogers Delinda L
Purchase Details
Closed on
Oct 16, 1998
Sold by
King Loretta L and Mallard Sharon B
Bought by
Keighley James R
Purchase Details
Closed on
Oct 15, 1998
Sold by
Keighley Barbara S
Bought by
Keighley James R
Purchase Details
Closed on
Nov 25, 1996
Sold by
Berry Walter H
Bought by
King Loretta L and Mallard Sharon B
Home Financials for this Owner
Home Financials are based on the most recent Mortgage that was taken out on this home.
Original Mortgage
$31,500
Interest Rate
7.88%
Create a Home Valuation Report for This Property
The Home Valuation Report is an in-depth analysis detailing your home's value as well as a comparison with similar homes in the area
Home Values in the Area
Average Home Value in this Area
Purchase History
| Date | Buyer | Sale Price | Title Company |
|---|---|---|---|
| The Delinda L Rogers Trust | -- | None Available | |
| Rogers Delinda L | $48,000 | -- | |
| Keighley James R | $48,500 | First Centennial Title Co | |
| Keighley James R | -- | First Centennial Title Co | |
| King Loretta L | $42,000 | First American Title Co |
Source: Public Records
Mortgage History
| Date | Status | Borrower | Loan Amount |
|---|---|---|---|
| Previous Owner | King Loretta L | $31,500 |
Source: Public Records
Tax History Compared to Growth
Tax History
| Year | Tax Paid | Tax Assessment Tax Assessment Total Assessment is a certain percentage of the fair market value that is determined by local assessors to be the total taxable value of land and additions on the property. | Land | Improvement |
|---|---|---|---|---|
| 2025 | $470 | $26,103 | $14,945 | $11,158 |
| 2024 | $470 | $25,547 | $13,755 | $11,792 |
| 2023 | $457 | $25,260 | $14,630 | $10,630 |
| 2022 | $444 | $20,949 | $11,585 | $9,364 |
| 2021 | $432 | $16,890 | $7,350 | $9,540 |
| 2020 | $417 | $17,153 | $7,350 | $9,803 |
| 2019 | $405 | $16,754 | $7,035 | $9,719 |
| 2018 | $390 | $14,423 | $4,760 | $9,663 |
| 2017 | $382 | $13,436 | $3,710 | $9,726 |
| 2016 | $373 | $13,318 | $3,150 | $10,168 |
| 2015 | $104 | $13,726 | $3,220 | $10,506 |
| 2014 | $361 | $12,651 | $2,485 | $10,166 |
| 2013 | -- | $9,323 | $1,540 | $7,783 |
Source: Public Records
Map
Nearby Homes
- 3200 Bristle Branch Dr
- 3198 Bristle Branch Dr
- 3188 Bristle Branch Dr
- 3167 Bristle Branch Dr
- 3104 Sandy St
- 930 Spanish Springs Rd
- 3071 Meadowlands Dr
- 745 Glen Vista Dr
- 1069 Palmwood Dr
- 1128 Bradley Square
- 120 E Lenwood Dr
- 1029 Baywood Dr Unit D
- 1095 E York Way
- 1035 Baywood Dr Unit D
- 3595 Rocky Ridge Ct
- 913 Glen Molly Dr
- 1051 Glen Martin Dr
- 3245 Elaine Way
- 3602 Oakridge Dr
- 1031 Vintage Hills Pkwy
- 3204 Bristle Branch Dr
- 3202 Bristle Branch Dr
- 3214 Bristle Branch Dr
- 3212 Bristle Branch Dr Unit 70A
- 3208 Bristle Branch Dr Unit 69A
- 3210 Bristle Branch Dr
- 3216 Bristle Branch Dr Unit 71A
- 3196 Bristle Branch Dr
- 3222 Bristle Branch Dr
- 3220 Bristle Branch Dr
- 3194 Bristle Branch Dr
- 3192 Bristle Branch Dr
- 3224 Bristle Branch Dr Unit 73A
- 3226 Bristle Branch Dr
- 3190 Bristle Branch Dr
- 3230 Bristle Branch Dr
- 3196 Independent Ct
- 3186 Bristle Branch Dr Unit 63B
- 3184 Bristle Branch Dr Unit 63A
- 3200 Independent Ct