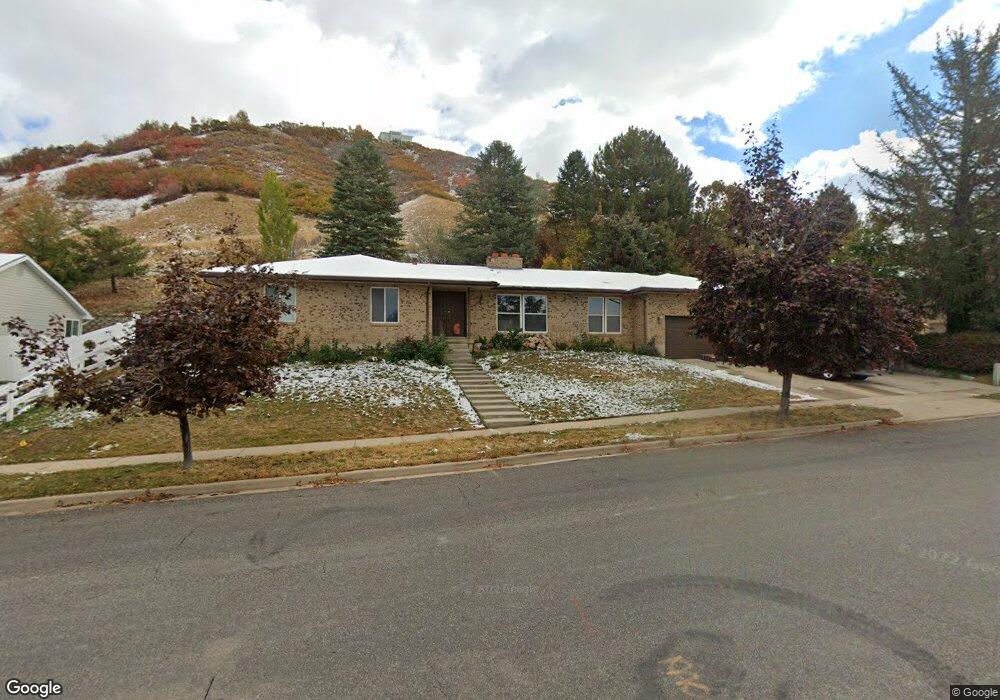
3207 Bountiful Blvd Bountiful, UT 84010
Estimated Value: $717,000 - $825,000
5
Beds
4
Baths
1,846
Sq Ft
$411/Sq Ft
Est. Value
About This Home
This home is located at 3207 Bountiful Blvd, Bountiful, UT 84010 and is currently estimated at $758,388, approximately $410 per square foot. 3207 Bountiful Blvd is a home located in Davis County with nearby schools including Boulton School, Mueller Park Junior High School, and Woods Cross High School.
Ownership History
Date
Name
Owned For
Owner Type
Purchase Details
Closed on
Jul 16, 2022
Sold by
Duncan Kristine E
Bought by
Coleman Ronald J and Duncan Kristine E
Current Estimated Value
Home Financials for this Owner
Home Financials are based on the most recent Mortgage that was taken out on this home.
Original Mortgage
$1,155,000
Outstanding Balance
$1,098,604
Interest Rate
5.23%
Mortgage Type
New Conventional
Estimated Equity
-$340,216
Purchase Details
Closed on
Jul 16, 2003
Sold by
Knight Nancy R
Bought by
Duncan Kristine E
Home Financials for this Owner
Home Financials are based on the most recent Mortgage that was taken out on this home.
Original Mortgage
$192,000
Interest Rate
5.18%
Mortgage Type
Purchase Money Mortgage
Purchase Details
Closed on
Dec 20, 2001
Sold by
Andre Thomas P and Andre Lucy Knight
Bought by
Knight Nancy R
Create a Home Valuation Report for This Property
The Home Valuation Report is an in-depth analysis detailing your home's value as well as a comparison with similar homes in the area
Purchase History
| Date | Buyer | Sale Price | Title Company |
|---|---|---|---|
| Coleman Ronald J | -- | None Listed On Document | |
| Duncan Kristine E | -- | Aspen Title Insurance Agency | |
| Knight Nancy R | -- | -- |
Source: Public Records
Mortgage History
| Date | Status | Borrower | Loan Amount |
|---|---|---|---|
| Open | Coleman Ronald J | $1,155,000 | |
| Previous Owner | Duncan Kristine E | $192,000 | |
| Closed | Duncan Kristine E | $48,000 |
Source: Public Records
Tax History
| Year | Tax Paid | Tax Assessment Tax Assessment Total Assessment is a certain percentage of the fair market value that is determined by local assessors to be the total taxable value of land and additions on the property. | Land | Improvement |
|---|---|---|---|---|
| 2025 | $4,422 | $374,550 | $140,289 | $234,261 |
| 2024 | $3,952 | $347,050 | $154,736 | $192,314 |
| 2023 | $4,188 | $651,000 | $320,461 | $330,539 |
| 2022 | $4,112 | $363,000 | $173,092 | $189,908 |
| 2021 | $3,782 | $520,000 | $248,098 | $271,902 |
| 2020 | $3,403 | $441,000 | $212,070 | $228,930 |
| 2019 | $3,089 | $396,000 | $156,579 | $239,421 |
| 2018 | $2,864 | $367,000 | $148,352 | $218,648 |
| 2016 | $2,547 | $176,220 | $75,901 | $100,319 |
| 2015 | $2,476 | $161,205 | $75,901 | $85,304 |
| 2014 | $2,260 | $149,815 | $75,901 | $73,914 |
| 2013 | -- | $149,417 | $60,858 | $88,559 |
Source: Public Records
Map
Nearby Homes
- 3252 Sunset Hollow Dr
- 438 Indian Springs Rd
- 424 E Canyon Estates Dr S Unit 1C
- 3759 S Huntington Dr
- 4031 Mountain Oaks Dr Unit 308
- 3893 S Bountiful Blvd
- 0 Bountiful Blvd
- 3716 S Oakridge Cir
- 407 Hidden Lake Dr
- 8 E 3500 S
- 842 E 2150 S
- 348 Hidden Lake Dr
- 348 Hidden Lake Dr Unit 107
- 626 E 2150 S
- 3285 S Davis Blvd
- 69 E North Canyon Rd
- 2136 Elaine Dr
- 141 W 3100 S
- 19 E North Canyon Rd
- 320 E 2100 S
- 3231 Bountiful Blvd
- 3185 Bountiful Blvd
- 3161 Bountiful Blvd
- 3185 Bountiful Blvd
- 3253 Bountiful Blvd
- 3202 Bountiful Blvd
- 3188 Bountiful Blvd
- 3222 Bountiful Blvd
- 3240 Bountiful Blvd
- 3176 Bountiful Blvd
- 3277 Bountiful Blvd
- 3240 Bountiful Blvd
- 3151 Bountiful Blvd
- 3164 Bountiful Blvd
- 3262 Bountiful Blvd
- 3301 Bountiful Blvd
- 3301 Bountiful Blvd
- 3143 Bountiful Blvd
- 3152 Bountiful Blvd
- 977 Oakwood Dr
Your Personal Tour Guide
Ask me questions while you tour the home.